
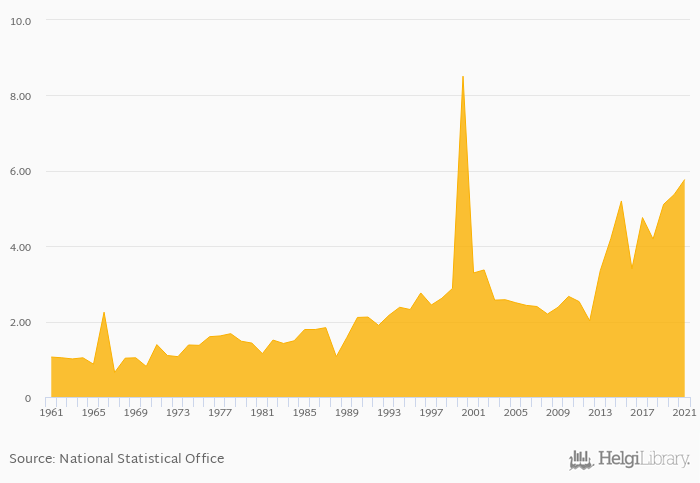
Onion consumption per capita rose 7.45% to 5.77 kg in Botswana in 2021, according to Faostat.
Historically, onion consumption per capita in Botswana reached an all time high of 8.51 kg in 2000 and an all time low of 0.650 kg in 1967. When compared to Botswana's main peers, onion consumption per capita in Namibia amounted to 7.11 kg, 9.28 kg in South Africa, 2.14 kg in Zambia and 0.220 kg in Zimbabwe in 2021.
Botswana has been ranked 111th within the group of 156 countries we follow in terms of onion consumption per capita, 13 places above the position seen 10 years ago.
| Onion Consumption Per Capita | Unit | 2001 | 2002 | 2003 | 2004 | 2005 | 2006 | 2007 | 2008 | 2009 | 2010 | 2011 | 2012 | 2013 | 2014 | 2015 | 2016 | 2017 | 2018 | 2019 | 2020 | 2021 |
| Angola | kg | 1.05 | 0.910 | 0.880 | 0.620 | 0.630 | ||||||||||||||||
| Botswana | kg | 5.20 | 3.40 | 4.76 | 4.19 | 5.11 | ||||||||||||||||
| Dem. Republic of the Congo | kg | ... | ... | ... | ... | ... | ... | ... | ... | ... | 0.830 | 0.800 | 0.780 | 0.770 | 0.690 | |||||||
| Lesotho | kg | ... | ... | ... | ... | ... | ... | ... | ... | ... | ... | ... | ... | ... | 1.42 | 1.10 | 0.010 | 0.070 | 1.08 | ... | ||
| Mozambique | kg | 5.45 | 7.13 | 8.15 | 9.04 | 11.4 | ||||||||||||||||
| Namibia | kg | 7.47 | 7.42 | 7.83 | 6.80 | 9.82 | ||||||||||||||||
| South Africa | kg | 9.94 | 9.39 | 9.82 | 9.89 | 9.02 | ||||||||||||||||
| Swaziland | kg | 4.61 | 4.01 | 4.39 | 4.72 | 5.23 | ||||||||||||||||
| Tanzania | kg | 3.43 | 3.65 | 3.76 | 3.96 | 2.75 | ||||||||||||||||
| Zambia | kg | 2.79 | 2.86 | 2.50 | 2.30 | 2.32 | ||||||||||||||||
| Zimbabwe | kg | 0.230 | 0.310 | 0.230 | 0.230 | 0.230 |
 Helgi Library


