Follow us for the latest automotive news.
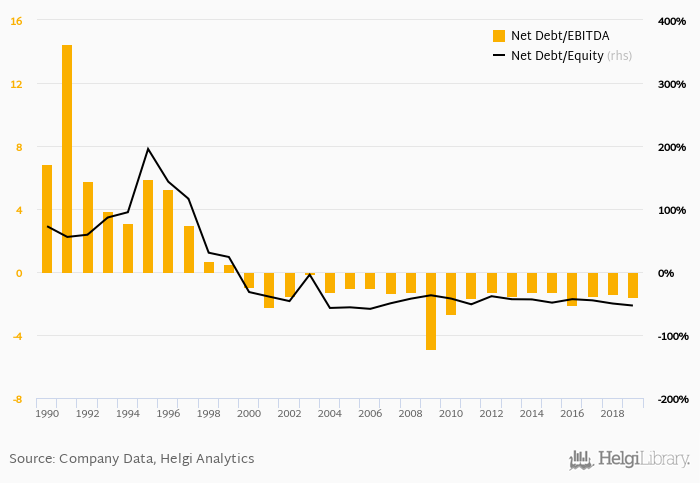
Paccar's net debt stood at USD -5,169 mil and accounted for -53.3% of equity at the end of 2019. The ratio is down 3.22 pp compared to the previous year.
Historically, the firm’s net debt to equity reached a high of 195% in 1995 and a low of -58.5% in 2006 between 1990 and 2019. The average for the last five years was -48.0%.
Net debt to EBITDA was calculated at -1.57x at the end of the year. That is down from -1.28x seen in 2014. The ratio reached a high of 14.5x in 1991 and a low of -4.90x in 2009.
The company’s cost of funding amounted to 1.92% in 2019, up which is above the 5-year of 1.53%. Funding costs have “eaten” some 6.85% of the operating profit generated in 2019.
You can see all the company’s data at Paccar profile, or you can download a report on the company in the report section.
 Helgi Library