
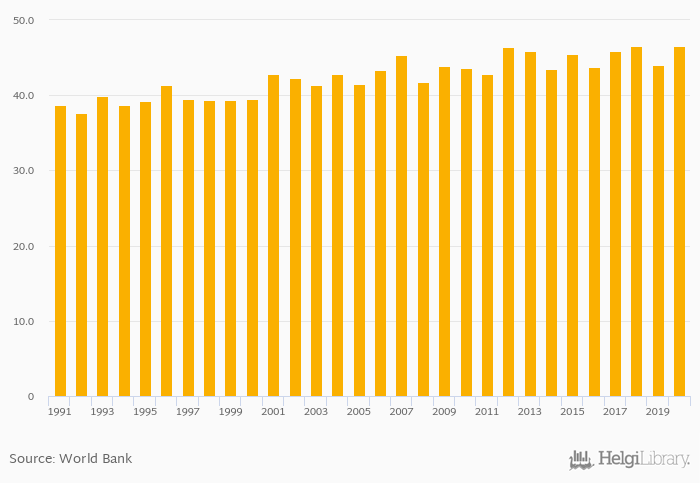
Part-Time Employed (As % of Total Workforce) rose 5.67% to 46.6% in Australia in 2020, according to World Bank.
Historically, Part-Time Employed (As % of Total Workforce) in Australia reached an all time high of 46.6% in 2020 and an all time low of 37.6% in 1992.
Australia has been ranked 8th within the group of 76 countries we follow in terms of Part-Time Employed (As % of Total Workforce), 1 place below the position seen 10 years ago.
| Part-Time Employed (As % of Total Workforce) | Unit | 2001 | 2002 | 2003 | 2004 | 2005 | 2006 | 2007 | 2008 | 2009 | 2010 | 2011 | 2012 | 2013 | 2014 | 2015 | 2016 | 2017 | 2018 | 2019 | 2020 | 2021 |
| Australia | % | 45.5% | 43.7% | 45.8% | 46.5% | 44.1% | ... | |||||||||||||||
| Cambodia | % | ... | ... | ... | ... | ... | ... | 19.4% | 16.1% | 16.8% | ... | 19.8% | ... | ... | ||||||||
| Indonesia | % | 31.6% | 30.7% | 31.1% | 32.2% | 32.6% | ||||||||||||||||
| Malaysia | % | ... | ... | ... | ... | ... | ... | ... | ... | 13.1% | 11.6% | ... | ... | 11.0% | ... | ... | ||||||
| New Zealand | % | 40.2% | 41.2% | 41.3% | 41.0% | 39.1% | ... | ... | ||||||||||||||
| Papua New Guinea | % | ... | ... | ... | ... | ... | ... | ... | ... | ... | ... | ... | ... | ... | ... | ... | ... | ... | ... | ... | ... | ... |
| Philippines | % | ... | ... | ... | ... | ... | 29.6% | 26.4% | 28.3% | 25.4% | 25.2% | |||||||||||
| Singapore | % | ... | ... | ... | ... | ... | ... | ... | ... | ... | ... | ... | ... | ... | ... | ... | 11.1% | 11.4% | ... | |||
| Thailand | % | ... | ... | ... | ... | ... | ... | ... | ... | 17.9% | 17.2% | 16.8% | 16.8% | 17.2% | ||||||||
| Vietnam | % | ... | ... | ... | ... | ... | ... | ... | 20.8% | 19.3% | 22.5% | 18.2% | 23.5% |
 Helgi Library


