
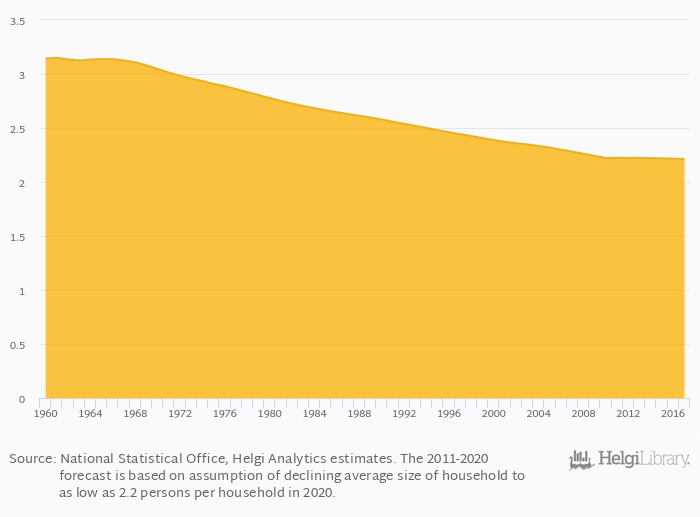
Persons per household fell 0.145% to 2.21 persons in France in 2017, according to the National Statistical Office.
Historically, persons per household in France reached an all time high of 3.15 persons in 1961 and an all time low of 2.21 persons in 2017. When compared to France's main peers, persons per household in Belgium amounted to 2.33 persons, 1.99 persons in Germany, 2.36 persons in Italy and 2.57 persons in Spain in 2017.
France has been ranked 102nd within the group of 111 countries we follow in terms of persons per household, 3 places above the position seen 10 years ago.
| Persons Per Household | Unit | 2000 | 2001 | 2002 | 2003 | 2004 | 2005 | 2006 | 2007 | 2008 | 2009 | 2010 | 2011 | 2012 | 2013 | 2014 | 2015 | 2016 | 2017 | 2018 | 2019 | 2020 |
| Austria | persons | 2.28 | 2.27 | 2.26 | 2.25 | 2.24 | ||||||||||||||||
| Belgium | persons | 2.35 | 2.34 | 2.34 | 2.33 | 2.32 | ||||||||||||||||
| France | persons | 2.22 | 2.22 | 2.22 | 2.21 | 2.21 | ||||||||||||||||
| Germany | persons | 2.02 | 2.01 | 2.00 | 1.99 | 1.98 | ||||||||||||||||
| Italy | persons | 2.43 | 2.40 | 2.38 | 2.36 | 2.34 | ||||||||||||||||
| Luxembourg | persons | 2.46 | 2.45 | 2.44 | 2.43 | 2.42 | ||||||||||||||||
| Morocco | persons | 4.66 | 4.62 | 4.60 | 4.58 | 4.55 | ||||||||||||||||
| Netherlands | persons | 2.22 | 2.21 | 2.20 | 2.19 | 2.18 | ||||||||||||||||
| Poland | persons | 2.78 | 2.77 | 2.76 | 2.75 | 2.73 | ||||||||||||||||
| Portugal | persons | 2.58 | 2.57 | 2.56 | 2.54 | 2.53 | ||||||||||||||||
| Slovenia | persons | 2.45 | 2.43 | 2.40 | 2.38 | 2.35 | ||||||||||||||||
| Spain | persons | 2.63 | 2.61 | 2.59 | 2.57 | 2.54 | ||||||||||||||||
| Switzerland | persons | 2.22 | 2.21 | 2.20 | 2.19 | 2.17 |
 Helgi Library


