
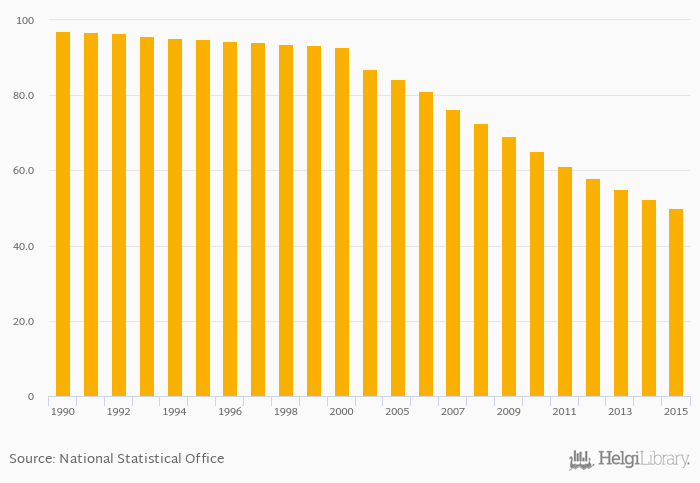
Petrol passenger cars as a share of total cars fell 4.47% to 50.0% in Norway in 2015, according to the National Statistical Office.
Historically, petrol passenger cars as a share of total cars in Norway reached an all time high of 97.0% in 1990 and an all time low of 50.0% in 2015.
Norway has been ranked 17th within the group of 26 countries we follow in terms of petrol passenger cars as a share of total cars, 9 places below the position seen 10 years ago.
| Petrol Passenger Cars (As % of Total Cars) | Unit | 1996 | 1997 | 1998 | 1999 | 2000 | 2001 | 2002 | 2003 | 2004 | 2005 | 2006 | 2007 | 2008 | 2009 | 2010 | 2011 | 2012 | 2013 | 2014 | 2015 | 2016 |
| Australia | % | ... | ... | ... | ... | ... | ... | ... | ... | ... | ... | ... | ... | ... | ... | ... | ... | ... | ... | ... | ... | ... |
| Denmark | % | ... | ... | ... | ... | ... | ... | ... | ... | ... | ... | |||||||||||
| Finland | % | 92.6% | 92.4% | 92.5% | 93.0% | 93.3% | ||||||||||||||||
| Germany | % | ... | 72.1% | 70.9% | 69.5% | 68.3% | 67.2% | |||||||||||||||
| Iceland | % | ... | ... | ... | ... | ... | ... | ... | ... | ... | ... | ... | ||||||||||
| Indonesia | % | ... | ... | ... | ... | ... | ... | ... | ... | ... | ... | ... | ... | ... | ... | ... | ... | ... | ... | ... | ... | ... |
| Netherlands | % | 79.8% | 79.6% | 79.3% | ... | ... | ... | ... | ||||||||||||||
| New Zealand | % | ... | ... | ... | ... | ... | ... | ... | ... | ... | ... | ... | ... | ... | ... | ... | ... | ... | ... | ... | ... | ... |
| Norway | % | ... | ... | ... | 65.1% | 61.1% | 57.9% | 55.0% | 52.3% | |||||||||||||
| Papua New Guinea | % | ... | ... | ... | ... | ... | ... | ... | ... | ... | ... | ... | ... | ... | ... | ... | ... | ... | ... | ... | ... | ... |
| Russia | % | ... | ... | ... | ... | ... | ... | ... | ... | ... | ... | ... | ... | ... | ... | ... | ... | ... | ... | ... | ... | ... |
| Sweden | % | 80.7% | 76.9% | 73.3% | 70.3% | 67.3% | ||||||||||||||||
| United Kingdom | % | ... | ... | 64.2% | 62.3% | 60.9% | ... | ... |
 Helgi Library


