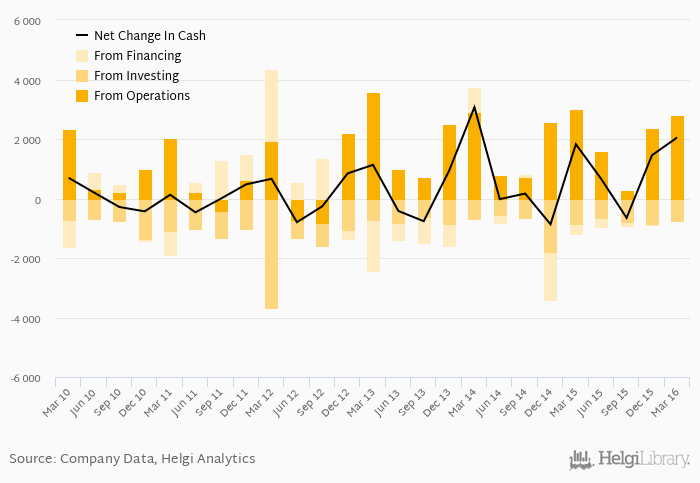
PGNiG's operating cash flow stood at PLN 2,806 mil in 1Q2016, down 6.96% when compared to the previous year. Historically, between 1Q2010 - 1Q2016, the firm’s operating cash flow reached a high of PLN 3,578 mil in 1Q2013 and a low of PLN -825 mil in 3Q2012.
PGNiG's total investments stood at PLN -768 mil and accounted for of sales in 1Q2016. This is compared to an average of
Severity: Warning
Message: Division by zero
Filename: models/Chunks_model.php
Line Number: 420
Cash from financing amounted to PLN 16.0 mil, so the company generated PLN 2,054 mil net cash in 1Q2016.
At the end of 1Q2016, the company had a net debt of PLN -1,934 mil, or -0.315x of EBITDA and -0.060 of equity. Net working capital amounted to PLN 1,421 mil, or 12.9% of sales. Cash conversion cycle is negative and reached 5.13 days days in 1Q2016. This means PGNiG generates revenue from customers before it has to pay its suppliers for inventory, among other things.
You can see all the company’s data at PGNiG profile, or you can download a report on the company in the report section.
 Helgi Library