
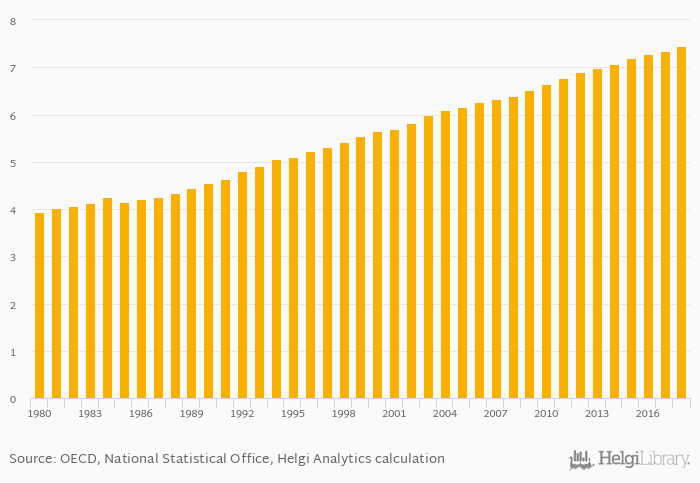
Pharmacists per 10,000 people rose 1.53% to 7.45 persons in Austria in 2018, according to OECD.
Historically, pharmacists per 10,000 people in Austria reached an all time high of 7.45 persons in 2018 and an all time low of 3.93 persons in 1980. When compared to Austria's main peers, pharmacists per 10,000 people in Germany amounted to 6.73 persons, 8.10 persons in Hungary, 11.9 persons in Italy and 7.05 persons in Switzerland in 2018.
Austria has been ranked 18th within the group of 26 countries we follow in terms of pharmacists per 10,000 people, 5 places below the position seen 10 years ago.
| Pharmacists (Per 10,000 People) | Unit | 1999 | 2000 | 2001 | 2002 | 2003 | 2004 | 2005 | 2006 | 2007 | 2008 | 2009 | 2010 | 2011 | 2012 | 2013 | 2014 | 2015 | 2016 | 2017 | 2018 | 2019 |
| Austria | persons | 6.99 | 7.08 | 7.19 | 7.29 | 7.34 | ... | |||||||||||||||
| Belgium | persons | 12.0 | 12.2 | 12.3 | 12.5 | 12.7 | ... | |||||||||||||||
| Czechia | persons | 5.99 | 6.30 | 6.52 | 6.71 | 6.83 | ... | |||||||||||||||
| France | persons | ... | ... | ... | ... | ... | ... | ... | ... | ... | ... | ... | ... | 10.9 | 10.9 | 10.9 | 10.8 | 10.7 | ... | |||
| Germany | persons | 6.24 | 6.33 | 6.42 | 6.42 | 6.57 | ... | |||||||||||||||
| Hungary | persons | 7.59 | 7.70 | 7.16 | 7.52 | 7.76 | ... | |||||||||||||||
| Italy | persons | ... | ... | ... | ... | ... | ... | ... | ... | ... | ... | ... | ... | ... | ... | 11.3 | 11.6 | 11.5 | 11.6 | 11.7 | ||
| Poland | persons | 7.22 | 7.31 | 7.43 | 7.75 | 7.79 | ... | ... | ||||||||||||||
| Slovakia | persons | ... | 6.14 | 6.73 | 7.08 | 7.75 | 7.88 | ... | ||||||||||||||
| Slovenia | persons | 5.76 | 6.03 | 6.28 | 6.58 | 6.91 | ... | |||||||||||||||
| Switzerland | persons | 6.49 | 6.53 | 6.53 | 7.12 | 7.10 | ... |
 Helgi Library


