PKN's net debt stood at PLN 5,467 mil and accounted for 0.224 of equity at the end of 1Q2016. The ratio is down 0.065 pp compared to the previous year.
Historically, the firm’s net debt to equity reached a high of 0.330 in 4Q2014 and a low of 0.169 in 4Q2013 between 1Q2013 and 1Q2016. The average for the last five years was 0.250%.
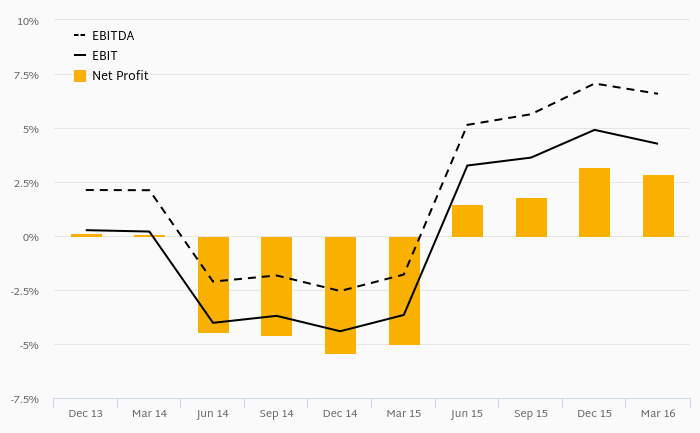
Net debt to EBITDA was calculated at 0.982x at the end of the quarter. That is up from x seen in 2011-03-31. The ratio reached a high of 3.86x in 1Q2014 and a low of -3.36x in 1Q2015.
The company’s cost of funding amounted to 5.48% in 1Q2016, down which is above the 5-year of 8.29%. Funding costs have “eaten” some 9.21% of the operating profit generated in 2019.
You can see all the company’s data at PKN profile, or you can download a report on the company in the report section.
 Helgi Library