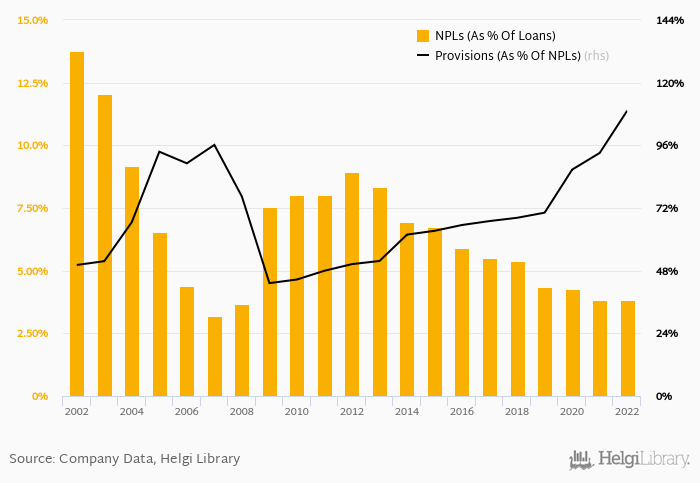
PKO BP's non-performing loans reached 3.83% of total loans at the end of 2022, down from 3.84% compared to the previous year. Historically, the NPL ratio hit an all time high of 13.8% in 2002 and an all time low of 3.19% in 2007.
Provision coverage amounted to 109% at the end of 2022, up from 93.1% compared to a year earlier.
The bank created loan loss provisions worth of 1.46% of average loans in 2022. That's compared to 0.776% of loans the bank put aside to its cost on average in the last five years.
Comparing PKO BP with its closest peers, Santander Bank Polska operated at the end of 2022 with NPL ratio of 4.37% and provision coverage of 85.0%, Pekao with 5.94% and 100% respectively and ING Bank Slaski had 2.23% of bad loans covered with 92.7% by provisions at the end of 2022.
You can see all the bank’s data at PKO BP Profile, or you can download a report on the bank in the report section.
 Helgi Library