
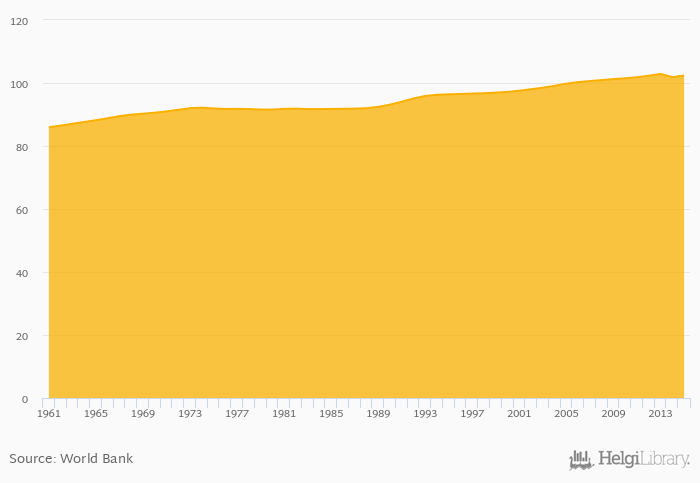
Population density rose 0.462% to 102 km per capita in Austria in 2015, according to Faostat.
Historically, population density in Austria reached an all time high of 103 km per capita in 2013 and an all time low of 85.9 km per capita in 1961. When compared to Austria's main peers, population density in Germany amounted to 232 km per capita, 110 km per capita in Hungary, 203 km per capita in Italy and 202 km per capita in Switzerland in 2015.
Austria has been ranked 69th within the group of 177 countries we follow in terms of population density, 4 places below the position seen 10 years ago.
| Population Density | Unit | 1995 | 1996 | 1997 | 1998 | 1999 | 2000 | 2001 | 2002 | 2003 | 2004 | 2005 | 2006 | 2007 | 2008 | 2009 | 2010 | 2011 | 2012 | 2013 | 2014 | 2015 |
| Austria | km per capita | 101 | 101 | 102 | 102 | 103 | ||||||||||||||||
| Belgium | km per capita | ... | ... | ... | ... | ... | 357 | 361 | 365 | 368 | 369 | |||||||||||
| Czechia | km per capita | 135 | 136 | 136 | 136 | 136 | ||||||||||||||||
| France | km per capita | 118 | 119 | 119 | 120 | 120 | ||||||||||||||||
| Germany | km per capita | 235 | 235 | 235 | 231 | 231 | ||||||||||||||||
| Hungary | km per capita | 111 | 110 | 110 | 110 | 109 | ||||||||||||||||
| Italy | km per capita | 201 | 202 | 202 | 202 | 205 | ||||||||||||||||
| Poland | km per capita | 125 | 125 | 126 | 126 | 126 | ||||||||||||||||
| Slovakia | km per capita | 112 | 112 | 112 | 112 | 113 | ||||||||||||||||
| Slovenia | km per capita | 101 | 102 | 102 | 102 | 102 | ||||||||||||||||
| Switzerland | km per capita | 196 | 198 | 200 | 202 | 205 |
 Helgi Library


