
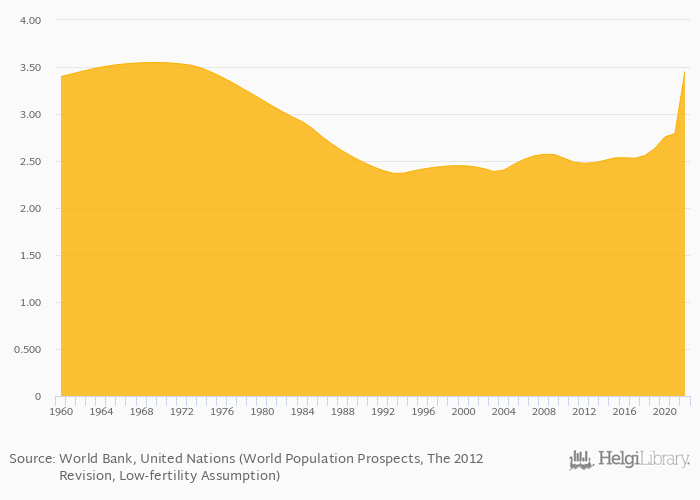
Population over 65 years old as a percentage of total population rose 23.7% to 3.45% in Oman in 2022, according to the National Statistical Office.
Historically, population over 65 years old as a percentage of total population in Oman reached an all time high of 3.55% in 1969 and an all time low of 2.37% in 1993. When compared to Oman's main peers, population over 65 years old as a percentage of total population in Iran amounted to 7.50%, 4.75% in Saudi Arabia, 1.05% in United Arab Emirates and 3.33% in Yemen in 2022.
Oman has been ranked 142nd within the group of 174 countries we follow in terms of population over 65 years old as a percentage of total population, 21 places above the position seen 10 years ago.
| Population Over 65 Years Old (As % of Total Population) | Unit | 2030 | 2031 | 2032 | 2033 | 2034 | 2035 | 2036 | 2037 | 2038 | 2039 | 2040 | 2041 | 2042 | 2043 | 2044 | 2045 | 2046 | 2047 | 2048 | 2049 | 2050 |
| Bahrain | % | 14.2% | 14.6% | 15.8% | 16.9% | 18.1% | ||||||||||||||||
| Djibouti | % | 10.1% | 10.4% | 10.7% | 11.1% | 11.4% | ||||||||||||||||
| Eritrea | % | 4.89% | 5.11% | 5.41% | 5.70% | 6.00% | ||||||||||||||||
| Iran | % | 18.8% | 19.5% | 20.6% | 21.6% | 22.7% | ||||||||||||||||
| Iraq | % | 6.88% | 7.10% | 7.32% | 7.54% | 7.76% | ||||||||||||||||
| Jordan | % | 11.6% | 12.0% | 12.5% | 13.0% | 13.5% | ||||||||||||||||
| Oman | % | 11.2% | 12.0% | 14.3% | 16.6% | 18.9% | ||||||||||||||||
| Pakistan | % | 9.02% | 9.28% | 9.62% | 9.97% | 10.3% | ||||||||||||||||
| Qatar | % | 19.7% | 21.1% | 23.3% | 25.4% | 27.5% | ||||||||||||||||
| Saudi Arabia | % | 16.1% | 16.8% | 17.6% | 18.3% | 19.1% | ||||||||||||||||
| Turkmenistan | % | 11.7% | 12.0% | 12.4% | 12.8% | 13.2% | ||||||||||||||||
| United Arab Emirates | % | 15.4% | 17.2% | 19.2% | 21.2% | 23.1% | ||||||||||||||||
| Yemen | % | 5.31% | 5.53% | 5.87% | 6.20% | 6.54% |
 Helgi Library


