Prabos Plus stock traded at CZK 412 per share at the end 2019 translating into a market capitalization of USD 18.2 mil. Since the end of 2014, the stock has depreciated by 1.44% representing an annual average growth of -0.289%.
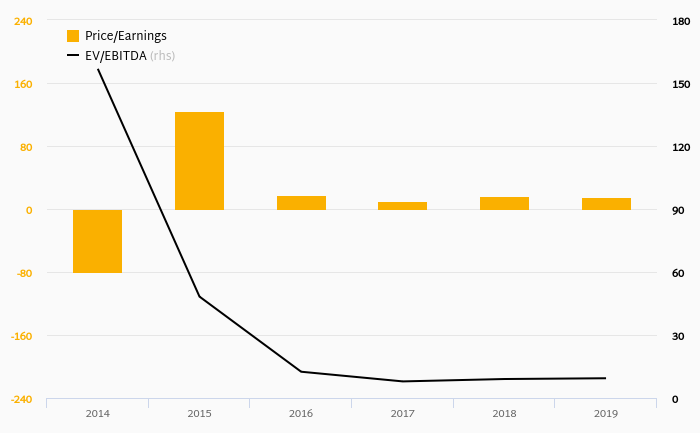
At the end of 2019, the firm traded at price to earnings of 15.5x. Over the last five years, this multiple achieved a high of 124x in 2015 and a low of 9.85x in 2017 with an average of 36.8x.
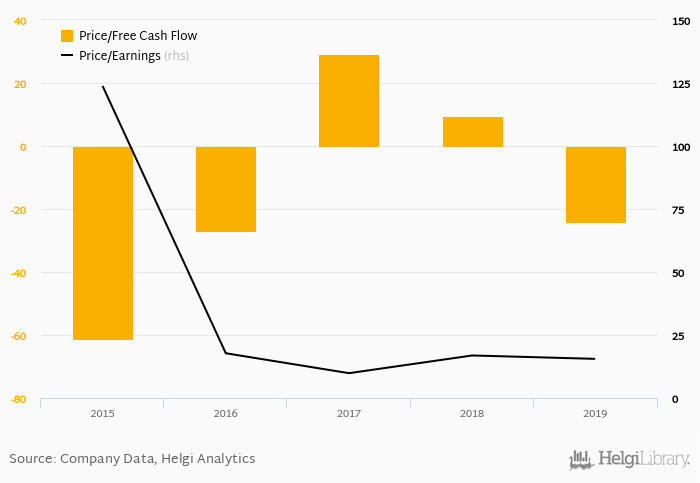
Regarding cash generated defined by the sum of net profit and depreciation, the stock traded at x at the end of 2019. When investments are excluded to get free cash flow, Prabos Plus traded at -24.2x.
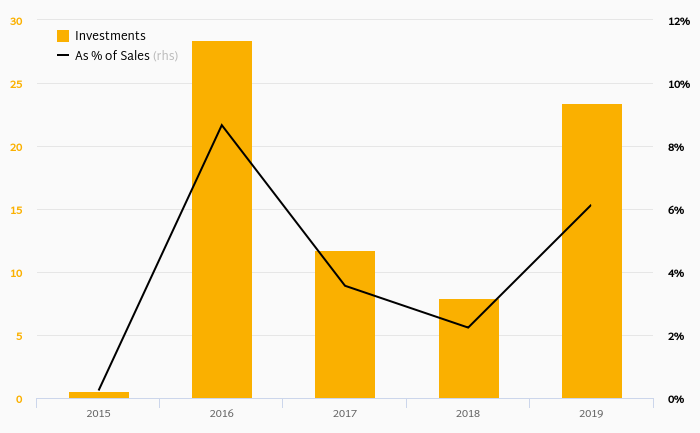
At the end of 2019, the company had a net debt of CZK 42.6 mil, or 0.887x of EBITDA and 33.8% of equity. The firm generated an average return on equity of 26.9% for its shareholders in the last five years and an average dividend yield of
Severity: Warning
Message: Division by zero
Filename: models/Chunks_model.php
Line Number: 498
You can see all the company’s data at Prabos Plus profile, or you can download a report on the company in the report section.
 Helgi Library