
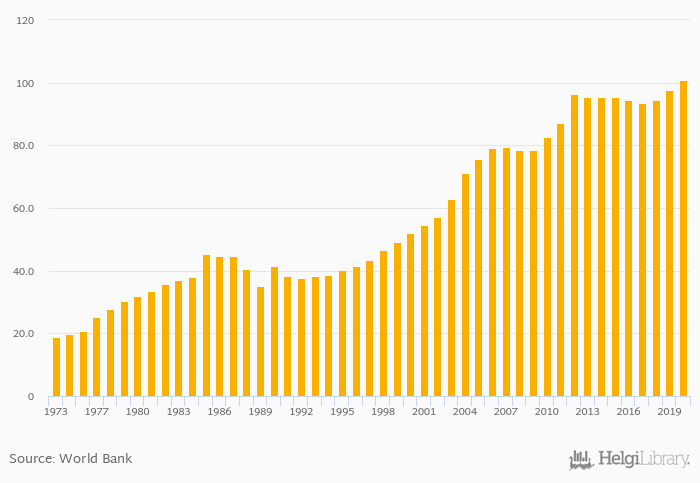
Primary completion rate of females as a percentage of total relevant group rose 3.11% to 101% in Morocco in 2020, according to World Bank.
Historically, primary completion rate of females as a percentage of total relevant group in Morocco reached an all time high of 101% in 2020 and an all time low of 18.8% in 1973.
Morocco has been ranked 39th within the group of 104 countries we follow in terms of primary completion rate of females as a percentage of total relevant group, 55 places above the position seen 10 years ago.
| Primary Completion Rate, Female (As % of Total Relevant Group) | Unit | 2001 | 2002 | 2003 | 2004 | 2005 | 2006 | 2007 | 2008 | 2009 | 2010 | 2011 | 2012 | 2013 | 2014 | 2015 | 2016 | 2017 | 2018 | 2019 | 2020 | 2021 |
| Algeria | % | 105% | 106% | 106% | 106% | 102% | ... | |||||||||||||||
| France | % | ... | ... | ... | ... | ... | ... | ... | ... | ... | ... | ... | ... | ... | ... | ... | ... | ... | ... | ... | ... | ... |
| Italy | % | 100% | 97.5% | 98.7% | 97.5% | 97.4% | ... | |||||||||||||||
| Libya | % | ... | ... | ... | ... | ... | ... | ... | ... | ... | ... | ... | ... | ... | ... | ... | ... | ... | ... | ... | ... | ... |
| Mali | % | 48.0% | 47.9% | 47.1% | ... | ... | ... | ... | ||||||||||||||
| Malta | % | 102% | 103% | 99.6% | 102% | 108% | ... | |||||||||||||||
| Mauritania | % | ... | ... | ... | ... | ... | 72.5% | 61.6% | 72.1% | 79.7% | 80.4% | ... | ... | |||||||||
| Morocco | % | 95.3% | 94.6% | 93.5% | 94.4% | 97.7% | ||||||||||||||||
| Portugal | % | ... | ... | ... | ... | ... | ... | ... | ... | ... | ... | ... | ... | ... | ... | ... | ... | ... | 99.5% | 99.2% | ... | |
| Senegal | % | 63.6% | 63.5% | 65.8% | ... | 67.2% | ||||||||||||||||
| Spain | % | ... | ... | ... | ... | 104% | 102% | 101% | 99.1% | 98.1% | ... | |||||||||||
| Tunisia | % | ... | ... | ... | 105% | 103% | 100% | ... | ... |
 Helgi Library


