
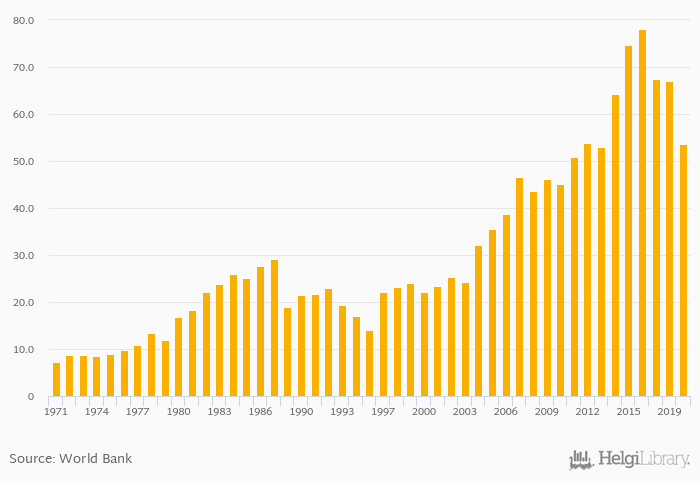
Primary completion rate of males as a percentage of total relevant group fell 19.9% to 53.7% in Niger in 2020, according to World Bank.
Historically, primary completion rate of males as a percentage of total relevant group in Niger reached an all time high of 78.0% in 2016 and an all time low of 7.28% in 1971.
Niger has been ranked 103rd within the group of 104 countries we follow in terms of primary completion rate of males as a percentage of total relevant group, 22 places above the position seen 10 years ago.
| Primary Completion Rate, Male (As % of Total Relevant Group) | Unit | 2001 | 2002 | 2003 | 2004 | 2005 | 2006 | 2007 | 2008 | 2009 | 2010 | 2011 | 2012 | 2013 | 2014 | 2015 | 2016 | 2017 | 2018 | 2019 | 2020 | 2021 |
| Algeria | % | 106% | 106% | 106% | 105% | 101% | ... | |||||||||||||||
| Burkina Faso | % | 60.6% | 59.5% | 60.8% | 62.6% | 61.0% | ||||||||||||||||
| Cameroon | % | ... | ... | 78.1% | 77.3% | 71.7% | 67.7% | 68.6% | ... | ... | ||||||||||||
| Chad | % | ... | ... | 45.3% | 49.6% | 45.0% | 47.4% | ... | ... | |||||||||||||
| Egypt | % | ... | ... | ... | 96.2% | 96.8% | 99.8% | 104% | ... | ... | ||||||||||||
| Libya | % | ... | ... | ... | ... | ... | ... | ... | ... | ... | ... | ... | ... | ... | ... | ... | ... | ... | ... | ... | ... | ... |
| Mali | % | 53.7% | 54.1% | 52.0% | ... | ... | ... | ... | ||||||||||||||
| Mauritania | % | ... | ... | ... | ... | ... | 68.4% | 57.0% | 67.4% | 72.5% | 65.7% | ... | ... | |||||||||
| Morocco | % | 97.2% | 95.5% | 92.4% | 92.8% | 96.6% | ||||||||||||||||
| Niger | % | 74.6% | 78.0% | 67.4% | ... | 67.1% | ||||||||||||||||
| Nigeria | % | ... | ... | ... | ... | ... | ... | ... | ... | ... | ||||||||||||
| Spain | % | ... | ... | ... | ... | 103% | 101% | 99.8% | 98.0% | 96.8% | ... | |||||||||||
| Sudan | % | ... | ... | ... | ... | ... | ... | ... | ... | ... | 62.2% | 61.8% | 62.9% | 66.1% | ... | ... | ... | |||||
| Tunisia | % | ... | 101% | 95.6% | 90.3% | ... | ... |
 Helgi Library


