
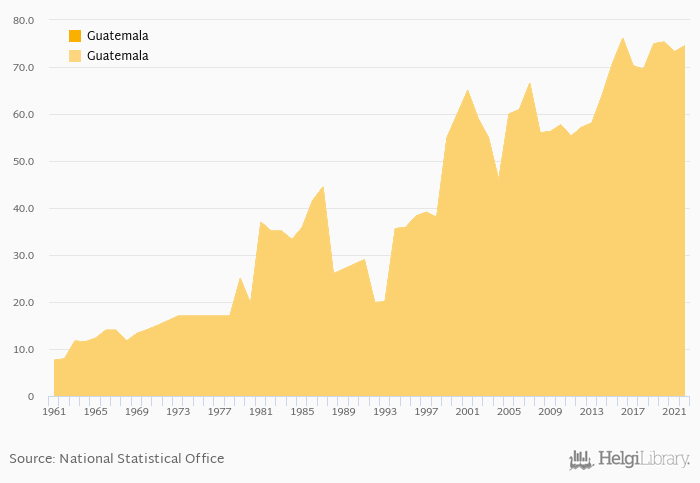
Production of cabbage and other brassica rose 1.71% to 74.5 kt in Guatemala in 2022, according to Faostat.
Historically, production of cabbage and other brassica in Guatemala reached an all time high of 76.1 kt in 2016 and an all time low of 7.60 kt in 1961. When compared to Guatemala's main peers, production of cabbage and other brassica in Belize amounted to 1.05 kt, 0.688 kt in El Salvador, 85.6 kt in Honduras and 71.9 kt in Nicaragua in 2022.
Guatemala has been ranked 54th within the group of 133 countries we follow in terms of production of cabbage and other brassica, 15 places above the position seen 10 years ago.
| Production of Cabbage and Other Brassica | Unit | 2002 | 2003 | 2004 | 2005 | 2006 | 2007 | 2008 | 2009 | 2010 | 2011 | 2012 | 2013 | 2014 | 2015 | 2016 | 2017 | 2018 | 2019 | 2020 | 2021 | 2022 |
| Belize | kt | 1.34 | 1.44 | 1.21 | 0.843 | 0.787 | ||||||||||||||||
| Costa Rica | kt | 28.5 | 28.7 | 28.7 | 19.5 | 18.0 | ||||||||||||||||
| El Salvador | kt | 0.772 | 0.657 | 0.674 | 0.701 | 0.677 | ||||||||||||||||
| Guatemala | kt | 76.1 | 70.3 | 69.5 | 74.9 | 75.3 | ||||||||||||||||
| Honduras | kt | 83.7 | 85.0 | 86.9 | 85.2 | 85.7 | ||||||||||||||||
| Mexico | kt | 228 | 238 | 215 | 204 | 245 | ||||||||||||||||
| Nicaragua | kt | 53.1 | 67.9 | 70.2 | 71.2 | 73.8 | ||||||||||||||||
| USA | kt | 1,007 | 1,081 | 885 | 1,009 | 1,069 |
 Helgi Library


