
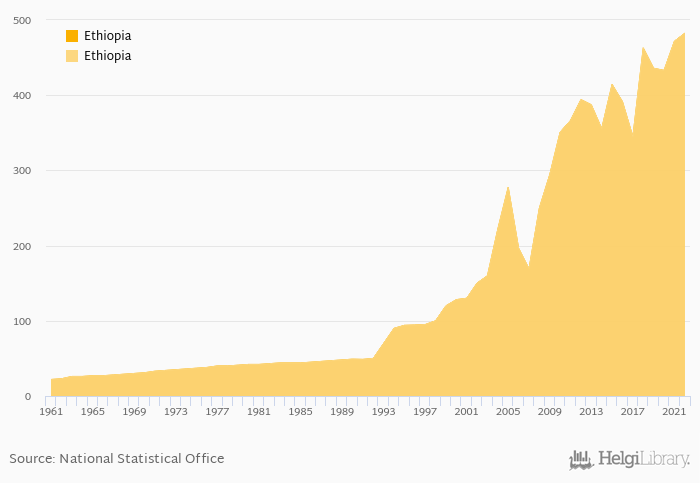
Production of cabbage and other brassica rose 2.24% to 482 kt in Ethiopia in 2022, according to Faostat.
Historically, production of cabbage and other brassica in Ethiopia reached an all time high of 482 kt in 2022 and an all time low of 22.0 kt in 1961.
Ethiopia has been ranked 19th within the group of 133 countries we follow in terms of production of cabbage and other brassica, 1 place above the position seen 10 years ago.
| Production of Cabbage and Other Brassica | Unit | 2002 | 2003 | 2004 | 2005 | 2006 | 2007 | 2008 | 2009 | 2010 | 2011 | 2012 | 2013 | 2014 | 2015 | 2016 | 2017 | 2018 | 2019 | 2020 | 2021 | 2022 |
| Chad | kt | ... | ... | ... | ... | ... | ... | ... | ... | ... | ... | ... | ... | ... | ... | ... | ... | ... | ... | ... | ... | ... |
| Djibouti | kt | 0.008 | 0.008 | 0.008 | 0.008 | 0.008 | ||||||||||||||||
| Egypt | kt | 519 | 486 | 452 | 534 | 473 | ||||||||||||||||
| Eritrea | kt | ... | ... | ... | ... | ... | ... | ... | ... | ... | ... | ... | ... | ... | ... | ... | ... | ... | ... | ... | ... | ... |
| Ethiopia | kt | 392 | 345 | 463 | 436 | 433 | ||||||||||||||||
| Kenya | kt | 776 | 764 | 674 | 829 | 944 | ||||||||||||||||
| Somalia | kt | ... | ... | ... | ... | ... | ... | ... | ... | ... | ... | ... | ... | ... | ... | ... | ... | ... | ... | ... | ... | ... |
| South Sudan | kt | ... | ... | ... | ... | ... | ... | ... | ... | ... | ... | ... | ... | ... | ... | ... | ... | ... | ... | ... | ... | ... |
| Sudan | kt | 2.58 | 3.20 | 2.78 | 2.92 | 2.97 | ||||||||||||||||
| Tanzania | kt | 83.7 | 83.6 | 84.8 | 84.0 | 84.1 | ||||||||||||||||
| Uganda | kt | ... | ... | ... | ... | ... | ... | ... | ... | ... | ... | ... | ... | ... | ... | ... | ... | ... | ... | ... | ... | ... |
| Yemen | kt | 7.76 | 7.49 | 7.71 | 7.65 | 7.62 |
 Helgi Library


