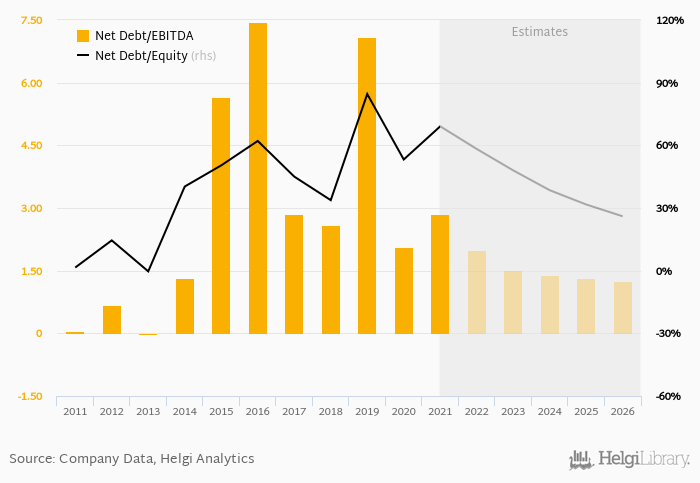
PTC's net debt stood at USD 1,350 mil and accounted for 69.1% of equity at the end of 2021. The ratio is up 15.9 pp compared to the previous year.
Historically, the firm’s net debt to equity reached a high of 84.6% in 2019 and a low of -0.336% in 2013 between 2011 and 2021. The average for the last five years was 57.1%.
Net debt to EBITDA was calculated at 2.85x at the end of the year.
Severity: Warning
Message: A non-numeric value encountered
Filename: src/Environment.php(358) : eval()'d code
Line Number: 21290
The company’s cost of funding amounted to 3.66% in 2021, down which is above the 5-year of 5.01%. Funding costs have “eaten” some 14.7% of the operating profit generated in 2019.
You can see all the company’s data at PTC profile, or you can download a report on the company in the report section.
 Helgi Library