
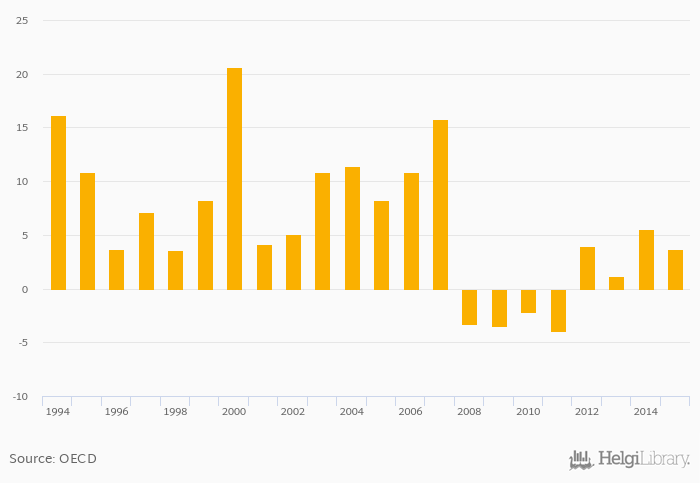
Real Gross Wage Growth fell 33.4% to 3.71% in Estonia in 2015, according to OECD.
Historically, Real Gross Wage Growth in Estonia reached an all time high of 20.6% in 2000 and an all time low of -3.91% in 2011.
Estonia has been ranked 15th within the group of 71 countries we follow in terms of Real Gross Wage Growth, 5 places above the position seen 10 years ago.
| Real Gross Wage Growth | Unit | 1997 | 1998 | 1999 | 2000 | 2001 | 2002 | 2003 | 2004 | 2005 | 2006 | 2007 | 2008 | 2009 | 2010 | 2011 | 2012 | 2013 | 2014 | 2015 | 2016 | 2017 |
| Australia | % | 2.29% | 1.27% | -0.554% | 0.128% | -0.839% | ||||||||||||||||
| Belarus | % | 2.50% | 34.9% | 17.0% | 13.8% | -8.69% | ||||||||||||||||
| China | % | 8.98% | 9.25% | 7.46% | 7.49% | 8.62% | ||||||||||||||||
| Estonia | % | -3.91% | 3.92% | 1.17% | 5.57% | 3.71% | ||||||||||||||||
| Finland | % | 0.252% | -0.281% | -0.863% | 0.101% | 1.52% | ||||||||||||||||
| Germany | % | 1.30% | 0.514% | 0.652% | 1.71% | 2.66% | ||||||||||||||||
| Indonesia | % | -1.05% | 1.10% | 4.74% | 1.69% | 0.313% | ... | ... | ||||||||||||||
| Japan | % | 1.92% | -2.31% | -0.609% | -2.59% | -0.498% | ||||||||||||||||
| Latvia | % | -32.6% | 1.34% | 3.83% | 65.8% | -2.85% | ||||||||||||||||
| Lithuania | % | -1.17% | 0.546% | ... | ... | ... | ... | ... | ||||||||||||||
| New Zealand | % | ... | ... | -2.49% | 2.11% | 5.58% | 4.02% | 2.00% | ||||||||||||||
| Papua New Guinea | % | ... | ... | ... | ... | ... | ... | ... | ... | ... | ... | ... | ... | ... | ... | ... | ... | ... | ... | ... | ... | ... |
| Russia | % | 3.09% | 8.88% | 5.12% | 1.25% | -10.8% | ||||||||||||||||
| USA | % | -0.425% | 0.640% | -0.581% | 1.36% | 2.62% |
 Helgi Library


