
At the end of January 1970, bank loans in the Czech Republic represented of GDP, up from seen a decade ago. By comparison, the figure was back in 1970. Loans increased by 0% yoy on average since 1970 and are ERROR: Division by zero NAN times since 1970.
At the end of January 1970, bank loans in the Czech Republic represented of GDP, up from seen a decade ago. By comparison, the figure was back in 2000. Loans increased by 0% yoy on average since 1970 and are ERROR: Division by zero NAN times since 1970.
At the end of January 1970, retail loans formed of GDP, up from some two decades ago. In other words, the average owed the bank at the end of 2021 compared to only in 2000.
Residential mortgage loans have grown from in 1970 to , i.e. from to of GDP. At the end of 2021, mortgages represented of total bank loans, up from back in 1970. This translates into an average growth of % a year.
Consumer bank loans have increased by % a year on average since 1970. At the end of January, they represented of GDP. This translates into an average of ERROR: Division by zero NAN owed per person assuming each citizen had a consumer loan.
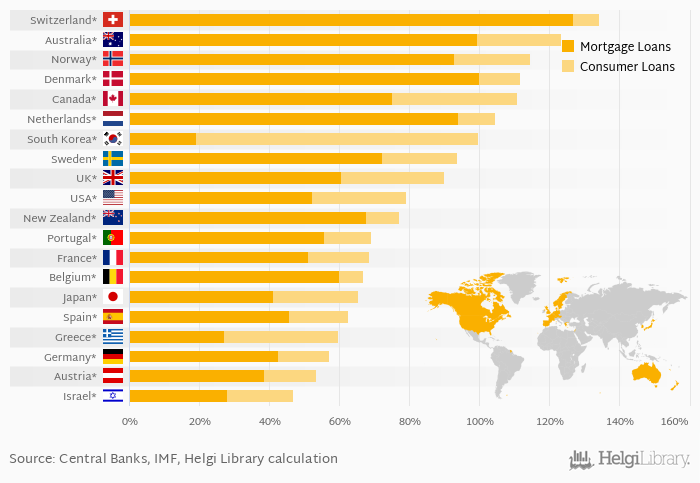
| Mortgage Loans (As % of GDP) | Unit | 2002 | 2003 | 2004 | 2005 | 2006 | 2007 | 2008 | 2009 | 2010 | 2011 | 2012 | 2013 | 2014 | 2015 | 2016 | 2017 | 2018 | 2019 | 2020 | 2021 | 2022 |
| Australia | % | 95.0% | 95.9% | 97.9% | 96.5% | 99.8% | ||||||||||||||||
| Austria | % | 36.6% | 35.0% | 35.8% | 36.3% | 34.4% | ||||||||||||||||
| Belgium | % | 54.2% | 54.2% | 52.8% | 54.5% | 59.9% | ||||||||||||||||
| Canada | % | 70.7% | 70.8% | 68.8% | 57.7% | 65.0% | ||||||||||||||||
| Denmark | % | 114% | 110% | 109% | 101% | 105% | ||||||||||||||||
| France | % | 44.8% | 46.2% | 43.9% | 45.2% | 51.0% | ... | ... | ||||||||||||||
| Germany | % | 35.6% | 35.6% | 33.2% | 34.9% | 37.7% | ||||||||||||||||
| Greece | % | 35.1% | 37.2% | 35.7% | 32.2% | 31.0% | ||||||||||||||||
| Israel | % | 26.0% | 26.2% | 25.9% | 27.1% | 29.8% | ||||||||||||||||
| Japan | % | 48.1% | 48.7% | 37.3% | 38.4% | 41.1% | ... | |||||||||||||||
| Netherlands | % | 73.4% | 70.7% | 61.0% | 91.2% | 93.8% | ||||||||||||||||
| New Zealand | % | 86.0% | 85.5% | 62.5% | 63.5% | 67.6% | ... | ... | ||||||||||||||
| Norway | % | ... | ... | 81.7% | 82.4% | 80.1% | 84.5% | 92.8% | ||||||||||||||
| Portugal | % | 61.1% | 57.3% | 0.517% | 0.274% | 0.252% | ... | |||||||||||||||
| South Korea | % | ... | ... | ... | ... | ... | ... | 19.2% | 17.7% | 17.7% | 18.3% | 19.0% | ... | |||||||||
| Spain | % | 48.1% | 45.5% | 71.2% | 70.5% | 69.7% | ||||||||||||||||
| Sweden | % | 66.2% | 72.6% | 51.3% | 51.4% | 53.1% | ||||||||||||||||
| Switzerland | % | 124% | 125% | 123% | 126% | 135% | ... | |||||||||||||||
| USA | % | 52.8% | 51.8% | 15.7% | 15.6% | 16.2% | ||||||||||||||||
| United Kingdom | % | 67.2% | 67.0% | 126% | 127% | 137% |
 Helgi Library


