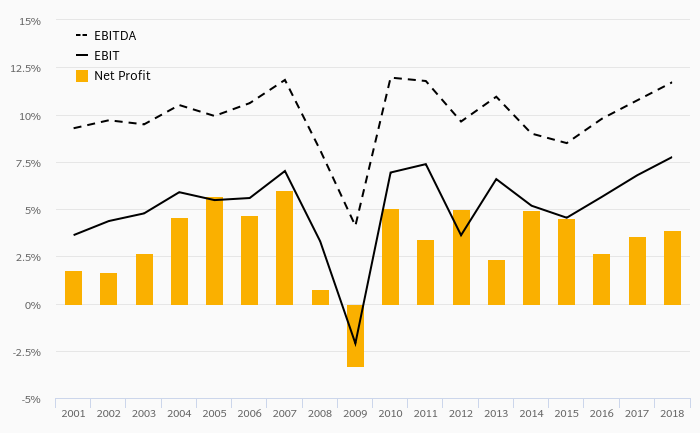
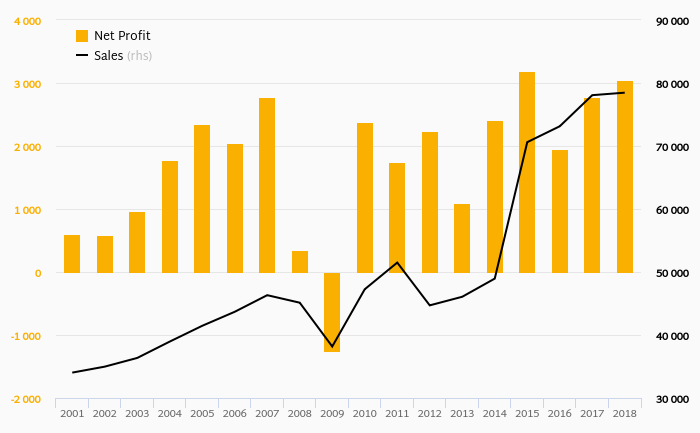
Robert Bosch made a net profit of EUR 3,047 mil with revenues of EUR 78,465 mil in 2018, up by 9.88% and up by 0.511%, respectively, compared to the previous year. This translates into a net margin of 3.88%.
On the operating level, EBITDA reached EUR 9,187 mil, up 9.5% compared to the previous year. Over the last five years, the company's EBITDA has risen 12.8% a year on average.
The company generated cash, defined by a sum of net profit and depreciation, of EUR 6,150 mil or 7.84% of sales. When investments are excluded, free cash flow reached EUR 1,157 mil, or 1.47% of sales in 2018.
In the last five years, the company generated free cash flow of EUR 3,556 mil. That compares to a cumulative net profit of EUR 13,372 mil in the same period.
You can see all the company’s data at Robert Bosch profile, or you can download a report on the company in the report section.
Net Profit | Unit | 1975 | 1976 | 1977 | 1978 | 1979 | 1980 | 1981 | 1982 | 1983 | 1984 | 1985 | 1986 | 1987 | 1988 | 1989 | 1990 | 1991 | 1992 | 1993 | 1994 | 1995 | 1996 | 1997 | 1998 | 1999 | 2000 | 2001 | 2002 | 2003 | 2004 | 2005 | 2006 | 2007 | 2008 | 2009 | 2010 | 2011 | 2012 | 2013 | 2014 | 2015 | 2016 | 2017 | 2018 | 2019 | 2020 | 2021 | 2022 | 2023 | 2024 |
HELLA Group | EUR mil | ... | ... | ... | ... | ... | ... | ... | ... | ... | ... | ... | ... | ... | ... | ... | ... | ... | ... | ... | ... | ... | ... | ... | ... | ... | ... | ... | ... | ... | ... | ... | ... | 201 | 264 | 268 | 260 | 367 | |||||||||||||
Mahle | EUR mil | ... | ... | ... | ... | ... | ... | ... | ... | ... | ... | ... | ... | ... | ... | ... | ... | ... | ... | ... | ... | ... | ... | ... | ... | ... | ... | ... | ... | ... | ... | ... | 236 | 279 | 122 | 63.0 | 102 | ... | ... | ... | ... | ... | ... | ||||||||
Robert Bosch | EUR mil | ... | ... | ... | ... | ... | ... | ... | ... | ... | ... | ... | ... | ... | ... | ... | ... | ... | ... | ... | ... | ... | ... | ... | ... | ... | ... | 1,096 | 2,410 | 3,193 | 1,949 | 2,773 | ... | ... | ... | ... | ... | ... | |||||||||||||
Sandler AG | EUR mil | ... | ... | ... | ... | ... | ... | ... | ... | ... | ... | ... | ... | ... | ... | ... | ... | ... | ... | ... | ... | ... | ... | ... | ... | ... | ... | ... | ... | ... | ... | ... | 20.0 | ... | ... | ... | ... | ... | ... | ... | ... | ... | ... | ... | |||||||
VEKA | EUR mil | ... | ... | ... | ... | ... | ... | ... | ... | ... | ... | ... | ... | ... | ... | ... | ... | ... | ... | ... | ... | ... | ... | ... | ... | ... | ... | ... | ... | ... | ... | ... | ... | ... | ... | 14.3 | 7.62 | ... | 36.0 | 32.2 | ... | ... | ... | ... | ... | ||||||
AVERAGE | EUR mil | ... | ... | ... | ... | ... | ... | ... | ... | ... | ... | ... | ... | ... | ... | ... | ... | ... | ... | ... | ... | ... | ... | ... | ... | ... | ... | 608 | 586 | 976 | 1,779 | 2,349 | 749 | 771 | 112 | -313 | 543 | 442 | 524 | 313 | 740 | 1,195 | 577 | 819 | 1,039 | 191 | -599 | 205 | 333 | 375 | 391 |