
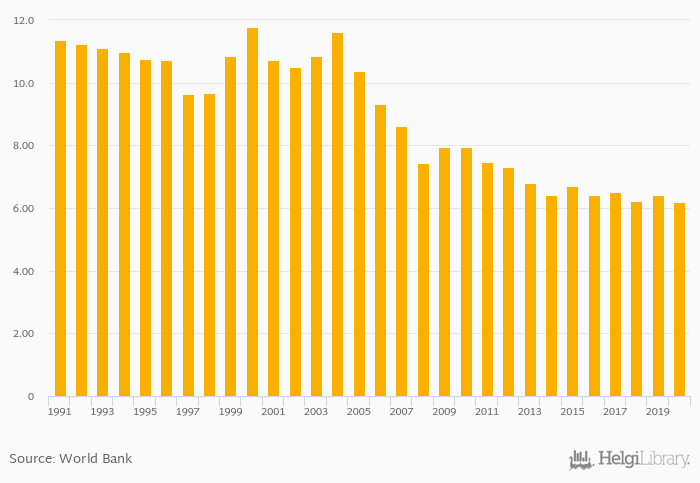
Self-Employed (As % of Total Workforce) fell 3.48% to 6.19% in Macao in 2020, according to World Bank.
Historically, Self-Employed (As % of Total Workforce) in Macao reached an all time high of 11.8% in 2000 and an all time low of 6.19% in 2020.
Macao has been ranked 165th within the group of 173 countries we follow in terms of Self-Employed (As % of Total Workforce), 3 places below the position seen 10 years ago.
| Self-Employed (As % of Total Workforce) | Unit | 2000 | 2001 | 2002 | 2003 | 2004 | 2005 | 2006 | 2007 | 2008 | 2009 | 2010 | 2011 | 2012 | 2013 | 2014 | 2015 | 2016 | 2017 | 2018 | 2019 | 2020 |
| China | % | 47.8% | 47.4% | 47.0% | 46.6% | 45.7% | ||||||||||||||||
| Hong Kong | % | 9.13% | 8.96% | 8.70% | 8.57% | 8.45% | ||||||||||||||||
| India | % | 79.5% | 78.8% | 78.1% | 77.3% | 76.5% | ||||||||||||||||
| Indonesia | % | 53.3% | 51.0% | 51.1% | 51.2% | 51.9% | ||||||||||||||||
| Japan | % | 11.4% | 11.1% | 10.6% | 10.4% | 10.3% | ||||||||||||||||
| Macao | % | 6.42% | 6.71% | 6.42% | 6.50% | 6.21% | ||||||||||||||||
| Malaysia | % | 24.6% | 26.1% | 25.6% | 26.0% | 27.6% | ||||||||||||||||
| Philippines | % | 42.5% | 41.0% | 38.6% | 37.8% | 36.5% | ||||||||||||||||
| Russia | % | 7.18% | 7.20% | 7.48% | 6.62% | 6.82% | ||||||||||||||||
| Singapore | % | 14.6% | 14.0% | 14.1% | 14.6% | 14.0% | ||||||||||||||||
| Taiwan | % | ... | ... | ... | ... | ... | ... | ... | ... | ... | ... | ... | ... | ... | ... | ... | ... | ... | ... | ... | ... | ... |
| Thailand | % | 52.6% | 51.6% | 50.9% | 50.6% | 51.5% | ||||||||||||||||
| USA | % | 6.45% | 6.44% | 6.39% | 6.25% | 6.28% | ||||||||||||||||
| Vietnam | % | 64.3% | 60.7% | 58.8% | 57.2% | 56.1% |
 Helgi Library


