
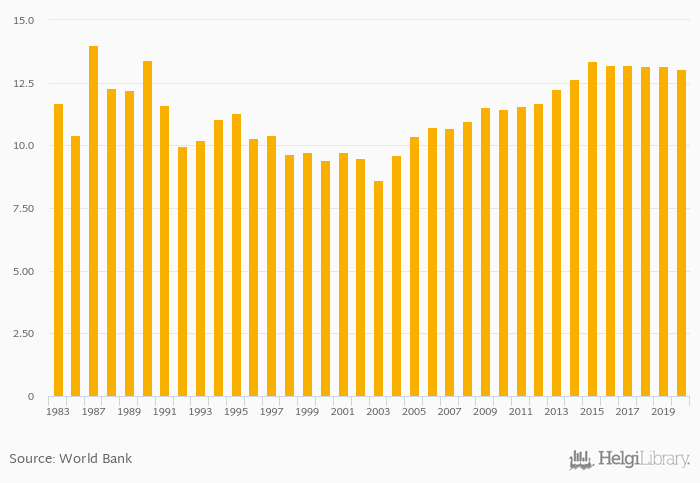
Self-Employed, Female (As % of Female Workforce) fell 0.897% to 13.0% in Netherlands in 2020, according to World Bank.
Historically, Self-Employed, Female (As % of Female Workforce) in Netherlands reached an all time high of 14.0% in 1987 and an all time low of 8.60% in 2003. When compared to Netherlands's main peers, Self-Employed, Female (As % of Female Workforce) in Belgium amounted to 10.6%, 5.11% in Denmark, 7.19% in Germany and 10.8% in United Kingdom in 2020.
Netherlands has been ranked 122nd within the group of 173 countries we follow in terms of Self-Employed, Female (As % of Female Workforce), 11 places above the position seen 10 years ago.
| Self-Employed, Female (As % of Female Workforce) | Unit | 2000 | 2001 | 2002 | 2003 | 2004 | 2005 | 2006 | 2007 | 2008 | 2009 | 2010 | 2011 | 2012 | 2013 | 2014 | 2015 | 2016 | 2017 | 2018 | 2019 | 2020 |
| Austria | % | 10.5% | 10.4% | 10.0% | 9.84% | 9.42% | ||||||||||||||||
| Belgium | % | 10.9% | 11.1% | 10.6% | 10.6% | 10.7% | ||||||||||||||||
| Denmark | % | 5.56% | 5.46% | 5.66% | 5.27% | 5.11% | ||||||||||||||||
| France | % | 8.15% | 8.15% | 8.37% | 8.52% | 8.34% | ||||||||||||||||
| Germany | % | 7.98% | 7.75% | 7.65% | 7.55% | 7.29% | ||||||||||||||||
| Ireland | % | 8.28% | 8.38% | 8.52% | 7.90% | 7.95% | ||||||||||||||||
| Luxembourg | % | 7.31% | 8.68% | 8.70% | 8.78% | 7.42% | ||||||||||||||||
| Netherlands | % | 12.7% | 13.4% | 13.2% | 13.2% | 13.1% | ||||||||||||||||
| Norway | % | 4.34% | 4.61% | 4.54% | 4.33% | 4.30% | ||||||||||||||||
| Poland | % | 17.7% | 17.6% | 16.8% | 16.1% | 16.0% | ||||||||||||||||
| Sweden | % | 6.21% | 6.23% | 6.12% | 5.78% | 5.60% | ||||||||||||||||
| United Kingdom | % | 10.5% | 10.4% | 10.9% | 11.0% | 10.9% |
 Helgi Library


