
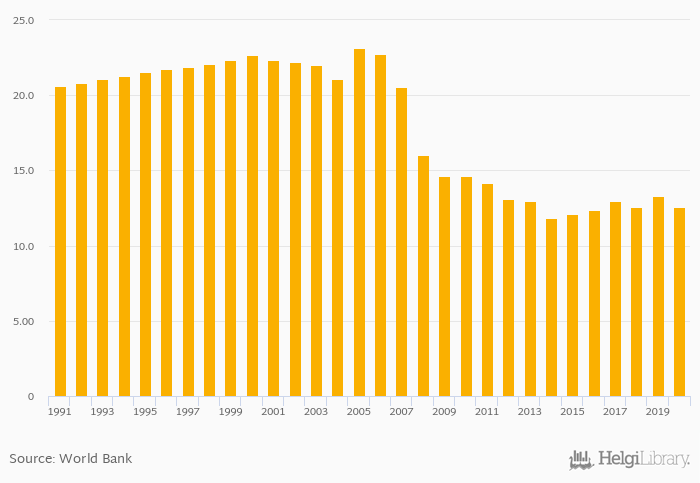
Self-Employed, Female (As % of Female Workforce) fell 5.68% to 12.6% in South Africa in 2020, according to World Bank.
Historically, Self-Employed, Female (As % of Female Workforce) in South Africa reached an all time high of 23.1% in 2005 and an all time low of 11.8% in 2014. When compared to South Africa's main peers, Self-Employed, Female (As % of Female Workforce) in Botswana amounted to 31.1%, 19.6% in Lesotho, 42.6% in Namibia and 41.2% in Swaziland in 2020.
South Africa has been ranked 124th within the group of 173 countries we follow in terms of Self-Employed, Female (As % of Female Workforce), 1 place below the position seen 10 years ago.
| Self-Employed, Female (As % of Female Workforce) | Unit | 2000 | 2001 | 2002 | 2003 | 2004 | 2005 | 2006 | 2007 | 2008 | 2009 | 2010 | 2011 | 2012 | 2013 | 2014 | 2015 | 2016 | 2017 | 2018 | 2019 | 2020 |
| Angola | % | 85.7% | 86.4% | 86.6% | 86.9% | 87.3% | ||||||||||||||||
| Botswana | % | 28.1% | 27.5% | 27.0% | 26.4% | 25.9% | ||||||||||||||||
| Lesotho | % | 59.5% | 58.7% | 57.7% | 57.0% | 56.5% | ||||||||||||||||
| Mozambique | % | 94.7% | 94.4% | 94.0% | 93.3% | 93.0% | ||||||||||||||||
| Namibia | % | 41.3% | 38.2% | 35.3% | 39.0% | 42.9% | ||||||||||||||||
| South Africa | % | 11.8% | 12.1% | 12.3% | 13.0% | 12.5% | ||||||||||||||||
| Swaziland | % | 40.5% | 41.0% | 41.6% | 41.4% | 41.3% | ||||||||||||||||
| Zambia | % | 87.4% | 86.7% | 85.7% | 84.1% | 84.5% | ||||||||||||||||
| Zimbabwe | % | 75.6% | 75.9% | 76.3% | 76.9% | 77.4% |
 Helgi Library


