
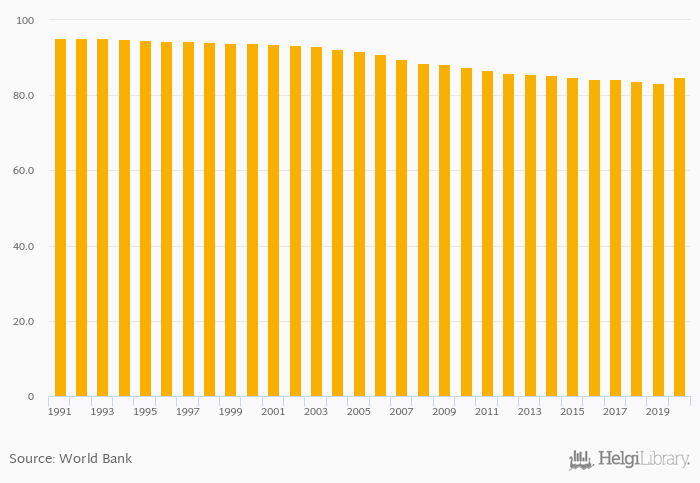
Self-Employed, Female (As % of Female Workforce) rose 2.08% to 84.9% in Uganda in 2020, according to World Bank.
Historically, Self-Employed, Female (As % of Female Workforce) in Uganda reached an all time high of 95.2% in 1992 and an all time low of 83.2% in 2019. When compared to Uganda's main peers, Self-Employed, Female (As % of Female Workforce) in Kenya amounted to 59.6%, 77.1% in Rwanda, 91.7% in South Sudan and 91.2% in Dem. Republic of the Congo in 2020.
Uganda has been ranked 31st within the group of 173 countries we follow in terms of Self-Employed, Female (As % of Female Workforce), 3 places below the position seen 10 years ago.
| Self-Employed, Female (As % of Female Workforce) | Unit | 2000 | 2001 | 2002 | 2003 | 2004 | 2005 | 2006 | 2007 | 2008 | 2009 | 2010 | 2011 | 2012 | 2013 | 2014 | 2015 | 2016 | 2017 | 2018 | 2019 | 2020 |
| Angola | % | 85.7% | 86.4% | 86.6% | 86.9% | 87.3% | ||||||||||||||||
| Burundi | % | 88.0% | 88.5% | 88.8% | 89.5% | 90.0% | ||||||||||||||||
| Central African Republic | % | 96.7% | 96.8% | 96.9% | 96.8% | 96.8% | ||||||||||||||||
| Congo | % | 90.5% | 91.1% | 91.4% | 91.4% | 91.5% | ||||||||||||||||
| Dem. Republic of the Congo | % | 90.2% | 90.1% | 90.2% | 89.8% | 89.0% | ||||||||||||||||
| Ethiopia | % | 90.3% | 89.5% | 88.8% | 88.1% | 87.3% | ||||||||||||||||
| Kenya | % | 63.9% | 62.2% | 60.6% | 59.5% | 58.3% | ||||||||||||||||
| Rwanda | % | 78.7% | 77.8% | 77.7% | 77.7% | 77.0% | ||||||||||||||||
| Somalia | % | 96.3% | 96.4% | 96.6% | 96.7% | 96.8% | ||||||||||||||||
| South Sudan | % | 96.3% | 96.0% | 96.0% | 96.0% | 95.9% | ||||||||||||||||
| Sudan | % | 66.8% | 66.4% | 65.6% | 64.7% | 64.0% | ||||||||||||||||
| Tanzania | % | 90.8% | 90.4% | 89.7% | 89.1% | 88.1% | ||||||||||||||||
| Uganda | % | 85.3% | 85.0% | 84.4% | 84.4% | 83.8% | ||||||||||||||||
| Zambia | % | 87.4% | 86.7% | 85.7% | 84.1% | 84.5% |
 Helgi Library


