
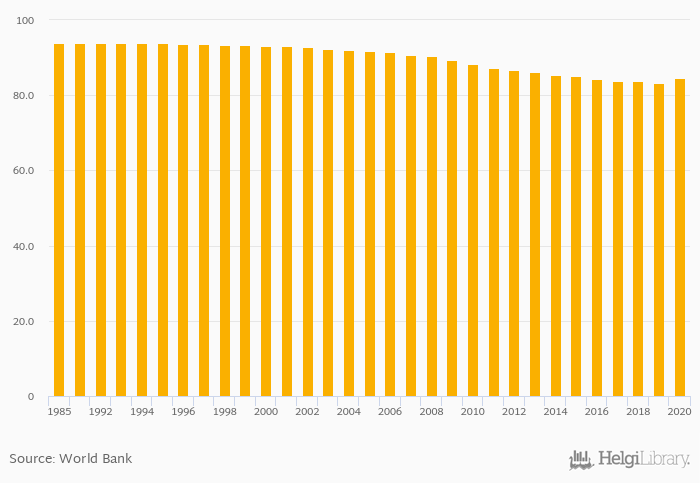
Self-Employed, Male (As % of Male Workforce) rose 1.49% to 84.5% in Burkina Faso in 2020, according to World Bank.
Historically, Self-Employed, Male (As % of Male Workforce) in Burkina Faso reached an all time high of 94.0% in 1985 and an all time low of 83.3% in 2019. When compared to Burkina Faso's main peers, Self-Employed, Male (As % of Male Workforce) in Ghana amounted to 66.9%, 65.3% in Ivory Coast, 76.5% in Mali and 91.8% in Niger in 2020.
Burkina Faso has been ranked 9th within the group of 173 countries we follow in terms of Self-Employed, Male (As % of Male Workforce), 5 places below the position seen 10 years ago.
| Self-Employed, Male (As % of Male Workforce) | Unit | 2000 | 2001 | 2002 | 2003 | 2004 | 2005 | 2006 | 2007 | 2008 | 2009 | 2010 | 2011 | 2012 | 2013 | 2014 | 2015 | 2016 | 2017 | 2018 | 2019 | 2020 |
| Algeria | % | 32.3% | 32.5% | 32.7% | 32.9% | 33.2% | ||||||||||||||||
| Benin | % | 84.2% | 83.8% | 84.1% | 83.5% | 83.2% | ||||||||||||||||
| Burkina Faso | % | 85.4% | 85.0% | 84.3% | 83.8% | 83.7% | ||||||||||||||||
| Chad | % | 84.0% | 84.1% | 86.0% | 87.0% | 87.2% | ||||||||||||||||
| Ghana | % | 68.6% | 68.4% | 68.5% | 67.1% | 65.8% | ||||||||||||||||
| Guinea | % | 86.8% | 87.3% | 86.0% | 85.1% | 85.3% | ||||||||||||||||
| Ivory Coast | % | 68.5% | 68.0% | 67.2% | 66.5% | 65.2% | ||||||||||||||||
| Liberia | % | 68.2% | 68.2% | 67.6% | 67.2% | 66.8% | ||||||||||||||||
| Libya | % | 38.6% | 40.5% | 41.9% | 41.0% | 39.9% | ||||||||||||||||
| Mali | % | 76.9% | 76.6% | 74.9% | 74.0% | 75.9% | ||||||||||||||||
| Mauritania | % | 50.3% | 50.0% | 49.0% | 48.5% | 48.1% | ||||||||||||||||
| Niger | % | 92.3% | 92.5% | 92.7% | 92.6% | 92.8% | ||||||||||||||||
| Togo | % | 71.6% | 69.7% | 67.6% | 65.7% | 64.8% |
 Helgi Library


