
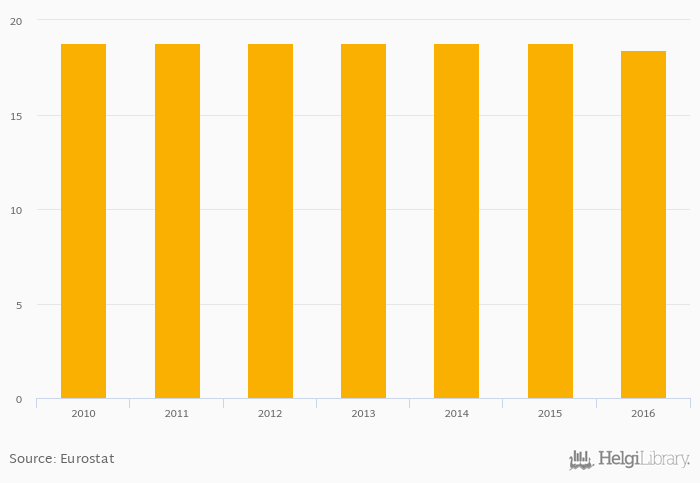
Share of Households with 3 Persons fell 2.13% to 18.4 in Croatia in 2016, according to Eurostat.
Historically, Share of Households with 3 Persons in Croatia reached an all time high of 18.8 in 2015 and an all time low of 18.4 in 2016.
Croatia has been ranked 5th within the group of 16 countries we follow in terms of Share of Households with 3 Persons, 5 places below the position seen 10 years ago.
| Share of Households with 3 Persons | Unit | 1996 | 1997 | 1998 | 1999 | 2000 | 2001 | 2002 | 2003 | 2004 | 2005 | 2006 | 2007 | 2008 | 2009 | 2010 | 2011 | 2012 | 2013 | 2014 | 2015 | 2016 |
| Albania | ... | ... | ... | ... | ... | ... | ... | ... | ... | ... | ... | ... | ... | ... | ... | ... | ... | ... | ... | ... | ... | |
| Austria | ... | ... | ... | ... | ... | ... | ... | 16.0 | 15.6 | 15.5 | 15.4 | 15.1 | ||||||||||
| Bosnia and Herzegovina | ... | ... | ... | ... | ... | ... | ... | ... | ... | ... | ... | ... | ... | ... | ... | ... | ... | ... | ... | ... | ... | |
| Croatia | ... | ... | ... | ... | ... | ... | ... | ... | ... | ... | ... | ... | ... | ... | 18.8 | 18.8 | 18.8 | 18.8 | 18.8 | |||
| Hungary | ... | ... | ... | ... | ... | ... | ... | ... | ... | 20.1 | 17.6 | 17.2 | 16.8 | 17.3 | ||||||||
| Italy | ... | ... | ... | ... | ... | ... | ... | ... | 20.3 | 20.2 | 20.0 | 19.5 | 19.6 | ... | ||||||||
| Montenegro | ... | ... | ... | ... | ... | ... | ... | ... | ... | ... | ... | ... | ... | ... | ... | ... | ... | ... | ... | ... | ... | |
| Romania | ... | ... | ... | ... | ... | ... | ... | ... | ... | ... | ... | 19.9 | 19.2 | 19.0 | 18.8 | 19.8 | ||||||
| Serbia | ... | ... | ... | ... | ... | ... | ... | ... | ... | ... | ... | ... | ... | ... | ... | ... | ... | 19.2 | 19.2 | ... | ||
| Slovenia | ... | ... | ... | ... | ... | ... | ... | ... | ... | 18.7 | 17.9 | 18.0 | 17.9 | 18.5 |
 Helgi Library


