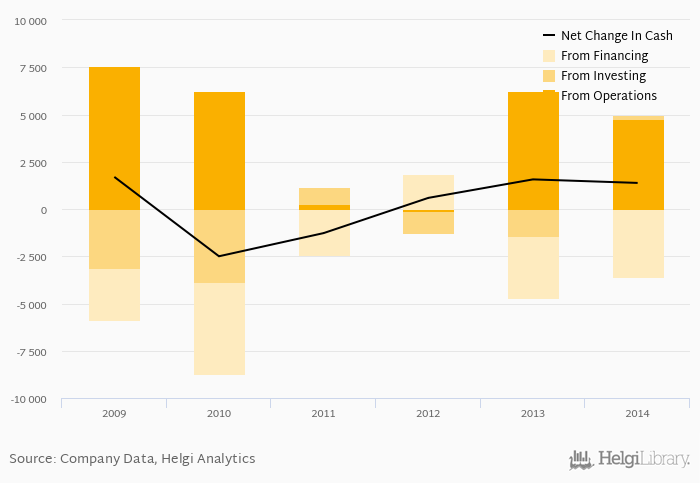
Skanska Group's operating cash flow stood at SEK 4,756 mil in 2014, down 23.9% when compared to the previous year. Historically, between 2009 - 2014, the firm’s operating cash flow reached a high of SEK 7,585 mil in 2009 and a low of SEK -91.0 mil in 2012.
Skanska Group's total investments stood at SEK 232 mil and accounted for of sales in 2014. This is compared to an average of
Severity: Warning
Message: Division by zero
Filename: models/Chunks_model.php
Line Number: 420
Cash from financing amounted to SEK -3,609 mil, so the company generated SEK 1,379 mil net cash in 2014.
At the end of 2014, the company had a net debt of SEK 16,636 mil, or x of EBITDA and 0.777 of equity. Net working capital amounted to SEK -6,191 mil, or -4.32% of sales. The cash conversion cycle stood at -24.1 days in 2014. This is an improvement compared to the previous year (-26.0 days), so Skanska Group’s working capital was tied up for 1.91 fewer days.
You can see all the company’s data at Skanska Group profile, or you can download a report on the company in the report section.
 Helgi Library