
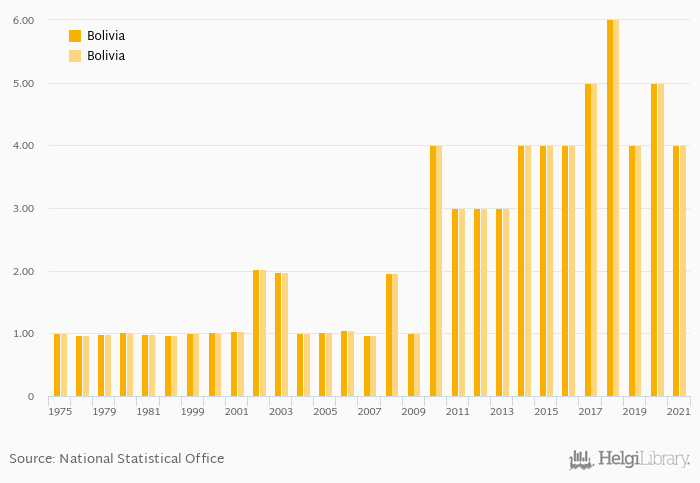
Total spice consumption fell 20.0% to 4.00 kt in Bolivia in 2021, according to Faostat.
Historically, total spice consumption in Bolivia reached an all time high of 6.00 kt in 2018 and an all time low of 0.968 kt in 2007. When compared to Bolivia's main peers, total spice consumption in Brazil amounted to 27.0 kt, 6.00 kt in Chile, 1.00 kt in Paraguay and 7.00 kt in Peru in 2021.
Bolivia has been ranked 104th within the group of 147 countries we follow in terms of total spice consumption, 1 place below the position seen 10 years ago.
| Spice Consumption (Total) | Unit | 2001 | 2002 | 2003 | 2004 | 2005 | 2006 | 2007 | 2008 | 2009 | 2010 | 2011 | 2012 | 2013 | 2014 | 2015 | 2016 | 2017 | 2018 | 2019 | 2020 | 2021 |
| Argentina | kt | 8.00 | 8.00 | 9.00 | 9.00 | 11.0 | ||||||||||||||||
| Bolivia | kt | 4.00 | 4.00 | 5.00 | 6.00 | 4.00 | ||||||||||||||||
| Brazil | kt | 23.0 | 24.0 | 23.0 | 24.0 | 23.0 | ||||||||||||||||
| Chile | kt | 3.00 | 4.00 | 5.00 | 5.00 | 4.00 | ||||||||||||||||
| Colombia | kt | 21.0 | 21.0 | 21.0 | 22.0 | 19.0 | ||||||||||||||||
| Paraguay | kt | 1.00 | 1.00 | 1.00 | 1.00 | 1.00 | ||||||||||||||||
| Peru | kt | 7.00 | 7.00 | 7.00 | 7.00 | 7.00 | ||||||||||||||||
| Uruguay | kt | ... | ... | ... | ... | ... | ... | ... | ... | ... | 1.00 | 1.00 | 1.00 | 1.00 | 1.00 | |||||||
| Venezuela | kt | 1.00 | 1.00 | ... | ... | ... |
 Helgi Library


