
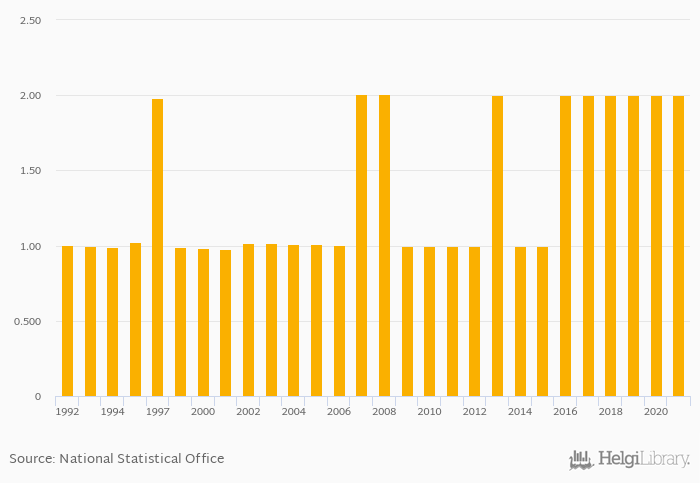
Total spice consumption rose 0% to 2.00 kt in Croatia in 2021, according to Faostat.
Historically, total spice consumption in Croatia reached an all time high of 2.01 kt in 2007 and an all time low of 0.978 kt in 2001.
Croatia has been ranked 128th within the group of 147 countries we follow in terms of total spice consumption, 1 place above the position seen 10 years ago.
| Spice Consumption (Total) | Unit | 2001 | 2002 | 2003 | 2004 | 2005 | 2006 | 2007 | 2008 | 2009 | 2010 | 2011 | 2012 | 2013 | 2014 | 2015 | 2016 | 2017 | 2018 | 2019 | 2020 | 2021 |
| Albania | kt | ... | ... | ... | ... | ... | ... | ... | ... | ... | ... | ... | ... | ... | ... | ... | ... | 1.00 | ... | 1.00 | ... | |
| Austria | kt | 8.00 | 8.00 | 8.00 | 9.00 | 9.00 | ||||||||||||||||
| Bosnia and Herzegovina | kt | 26.0 | 26.0 | 26.0 | 26.0 | 26.0 | ||||||||||||||||
| Croatia | kt | 1.00 | 2.00 | 2.00 | 2.00 | 2.00 | ||||||||||||||||
| Hungary | kt | 25.0 | 25.0 | 25.0 | 29.0 | 5.00 | ||||||||||||||||
| Italy | kt | 6.00 | 7.00 | 7.00 | 13.0 | 14.0 | ||||||||||||||||
| Montenegro | kt | ... | ... | ... | ... | ... | ... | ... | ... | ... | ... | ... | ... | ... | ... | ... | ... | ... | ... | ... | ... | ... |
| Romania | kt | 55.0 | 55.0 | 53.0 | 23.0 | 5.00 | ||||||||||||||||
| Serbia | kt | ... | ... | ... | ... | ... | 4.00 | 4.00 | 4.00 | 4.00 | 4.00 | |||||||||||
| Slovenia | kt | 2.00 | 2.00 | 2.00 | 2.00 | 1.00 |
 Helgi Library


