
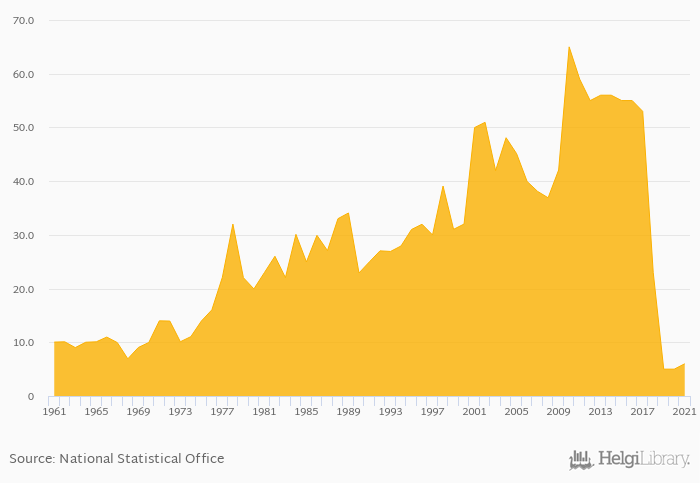
Total spice consumption rose 20.0% to 6.00 kt in Romania in 2021, according to Faostat.
Historically, total spice consumption in Romania reached an all time high of 65.0 kt in 2010 and an all time low of 5.00 kt in 2020. When compared to Romania's main peers, total spice consumption in Bulgaria amounted to 3.00 kt, 5.00 kt in Hungary, 1.00 kt in Moldova and 10.0 kt in Ukraine in 2021.
Romania has been ranked 86th within the group of 147 countries we follow in terms of total spice consumption, 62 places below the position seen 10 years ago.
| Spice Consumption (Total) | Unit | 2001 | 2002 | 2003 | 2004 | 2005 | 2006 | 2007 | 2008 | 2009 | 2010 | 2011 | 2012 | 2013 | 2014 | 2015 | 2016 | 2017 | 2018 | 2019 | 2020 | 2021 |
| Austria | kt | 8.00 | 8.00 | 8.00 | 9.00 | 9.00 | ||||||||||||||||
| Bulgaria | kt | 21.0 | 22.0 | 11.0 | 5.00 | 3.00 | ||||||||||||||||
| Czechia | kt | 7.00 | 7.00 | 7.00 | 7.00 | 5.00 | ||||||||||||||||
| Greece | kt | 5.00 | 5.00 | 5.00 | 6.00 | 4.00 | ||||||||||||||||
| Hungary | kt | 25.0 | 25.0 | 25.0 | 29.0 | 5.00 | ||||||||||||||||
| Moldova | kt | ... | ... | ... | ... | ... | ... | ... | ... | ... | ... | ... | ... | ... | ... | ... | ... | ... | 1.00 | 1.00 | ||
| Poland | kt | 12.0 | 13.0 | 14.0 | 15.0 | 19.0 | ||||||||||||||||
| Romania | kt | 55.0 | 55.0 | 53.0 | 23.0 | 5.00 | ||||||||||||||||
| Russia | kt | 29.0 | 55.0 | 31.0 | 31.0 | 38.0 | ||||||||||||||||
| Serbia | kt | ... | ... | ... | ... | ... | 4.00 | 4.00 | 4.00 | 4.00 | 4.00 | |||||||||||
| Slovakia | kt | 3.00 | 3.00 | 3.00 | 3.00 | 3.00 | ||||||||||||||||
| Turkey | kt | 167 | 151 | 165 | 190 | 223 | ||||||||||||||||
| Ukraine | kt | 8.00 | 7.00 | 7.00 | 8.00 | 8.00 |
 Helgi Library


