
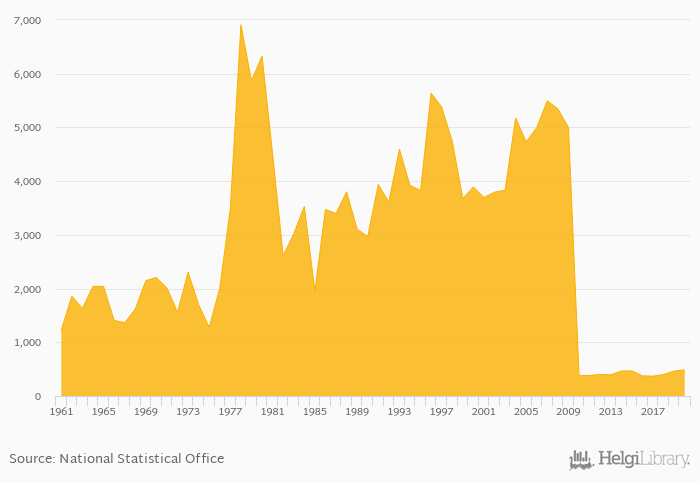
Total spice consumption rose 4.52% to 486 kt in China in 2020, according to Faostat.
Historically, total spice consumption in China reached an all time high of 6,911 kt in 1978 and an all time low of 370 kt in 2017. When compared to China's main peers, total spice consumption in India amounted to 4,808 kt, 140 kt in Japan, 38.0 kt in Russia and 381 kt in USA in 2020.
China has been ranked 5th within the group of 144 countries we follow in terms of total spice consumption, 2 places below the position seen 10 years ago.
| Spice Consumption (Total) | Unit | 2001 | 2002 | 2003 | 2004 | 2005 | 2006 | 2007 | 2008 | 2009 | 2010 | 2011 | 2012 | 2013 | 2014 | 2015 | 2016 | 2017 | 2018 | 2019 | 2020 | 2021 |
| Bangladesh | kt | 474 | 440 | 458 | 465 | 546 | ||||||||||||||||
| Canada | kt | 39.0 | 38.0 | 39.0 | 39.0 | 45.0 | ||||||||||||||||
| China | kt | 438 | 333 | 379 | 389 | 491 | ||||||||||||||||
| Germany | kt | 65.0 | 64.0 | 67.0 | 66.0 | 73.0 | ||||||||||||||||
| India | kt | 2,957 | 3,587 | 4,278 | 4,675 | 4,911 | ||||||||||||||||
| Japan | kt | 160 | 157 | 153 | 144 | 147 | ||||||||||||||||
| Mexico | kt | 141 | 140 | 137 | 147 | 139 | ||||||||||||||||
| Pakistan | kt | 324 | 305 | 300 | 318 | 271 | ||||||||||||||||
| Russia | kt | 29.0 | 55.0 | 31.0 | 31.0 | 38.0 | ||||||||||||||||
| South Korea | kt | 26.0 | 25.0 | 26.0 | 25.0 | 48.0 | ||||||||||||||||
| Sri Lanka | kt | 109 | 131 | 118 | 135 | 129 | ||||||||||||||||
| USA | kt | 308 | 310 | 313 | 318 | 347 |
 Helgi Library


