
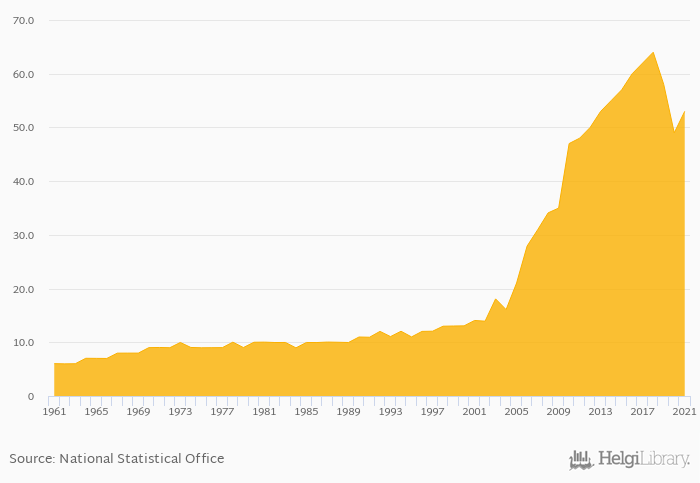
Total spice consumption rose 8.16% to 53.0 kt in Cameroon in 2021, according to Faostat.
Historically, total spice consumption in Cameroon reached an all time high of 64.0 kt in 2018 and an all time low of 5.99 kt in 1962.
Cameroon has been ranked 32nd within the group of 147 countries we follow in terms of total spice consumption, 4 places below the position seen 10 years ago.
| Spice Consumption (Total) | Unit | 2001 | 2002 | 2003 | 2004 | 2005 | 2006 | 2007 | 2008 | 2009 | 2010 | 2011 | 2012 | 2013 | 2014 | 2015 | 2016 | 2017 | 2018 | 2019 | 2020 | 2021 |
| Angola | kt | ... | 1.00 | ... | 1.00 | 1.00 | 1.00 | |||||||||||||||
| Benin | kt | 66.0 | 69.0 | 72.0 | 73.0 | 88.0 | ||||||||||||||||
| Cameroon | kt | 57.0 | 60.0 | 62.0 | 64.0 | 58.0 | ||||||||||||||||
| Central African Republic | kt | ... | ... | ... | ... | ... | ... | ... | ... | ... | ... | ... | ... | ... | ... | ... | ... | ... | ... | ... | ... | ... |
| Chad | kt | ... | ... | ... | ... | ... | ... | ... | ... | ... | ... | ... | ... | ... | ... | ... | ... | ... | ... | ... | ... | ... |
| Congo | kt | ... | ... | ... | ... | ... | ... | ... | ... | ... | ... | ... | ... | ... | ... | ... | ... | ... | ... | ... | ... | ... |
| Dem. Republic of the Congo | kt | ... | ... | ... | ... | ... | ... | ... | ... | ... | 36.0 | 36.0 | 38.0 | 39.0 | 39.0 | |||||||
| Equatorial Guinea | kt | ... | ... | ... | ... | ... | ... | ... | ... | ... | ... | ... | ... | ... | ... | ... | ... | ... | ... | ... | ... | ... |
| Gabon | kt | ... | ... | ... | ... | ... | ... | ... | ... | ... | ... | ... | ... | ... | ... | ... | ... | ... | ... | ... | ... | ... |
| Niger | kt | 16.0 | 16.0 | 17.0 | 19.0 | 17.0 | ||||||||||||||||
| Nigeria | kt | 244 | 239 | 247 | 251 | 631 | ||||||||||||||||
| Sudan | kt | ... | ... | ... | ... | ... | ... | ... | ... | ... | ... | ... | 12.0 | 14.0 | 13.0 | 16.0 | 14.0 |
 Helgi Library


