
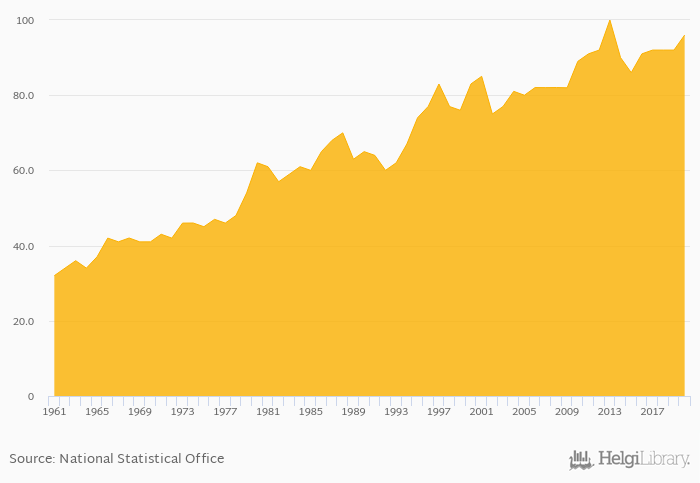
Total sugar & sweetener consumption rose 4.35% to 96.0 kt in Trinidad and Tobago in 2020, according to Faostat.
Historically, total sugar & sweetener consumption in Trinidad and Tobago reached an all time high of 100 kt in 2013 and an all time low of 32.0 kt in 1961.
Trinidad and Tobago has been ranked 137th within the group of 165 countries we follow in terms of total sugar & sweetener consumption, 7 places below the position seen 10 years ago.
| Sugar & Sweetener Consumption (Total) | Unit | 2000 | 2001 | 2002 | 2003 | 2004 | 2005 | 2006 | 2007 | 2008 | 2009 | 2010 | 2011 | 2012 | 2013 | 2014 | 2015 | 2016 | 2017 | 2018 | 2019 | 2020 |
| Brazil | kt | 8,733 | 8,746 | 8,792 | 8,849 | 8,905 | ||||||||||||||||
| Colombia | kt | 2,830 | 2,814 | 2,927 | 3,694 | 3,664 | ||||||||||||||||
| Dominican Republic | kt | 405 | 399 | 402 | 422 | 450 | ||||||||||||||||
| Guyana | kt | 44.0 | 43.0 | 48.0 | 45.0 | 44.0 | ||||||||||||||||
| Haiti | kt | 200 | 202 | 206 | 214 | 229 | ||||||||||||||||
| Jamaica | kt | 181 | 193 | 181 | 186 | 188 | ||||||||||||||||
| Puerto Rico | kt | ... | ... | ... | ... | ... | ... | ... | ... | ... | ... | ... | ... | ... | ... | ... | ... | ... | ... | ... | ... | ... |
| Suriname | kt | 30.0 | 29.0 | 29.0 | 31.0 | 35.0 | ||||||||||||||||
| Trinidad and Tobago | kt | 90.0 | 86.0 | 91.0 | 92.0 | 92.0 | ||||||||||||||||
| USA | kt | 21,112 | 21,280 | 21,422 | 21,407 | 21,096 | ||||||||||||||||
| Venezuela | kt | 1,189 | 1,144 | 1,062 | 1,020 | 884 |
 Helgi Library


