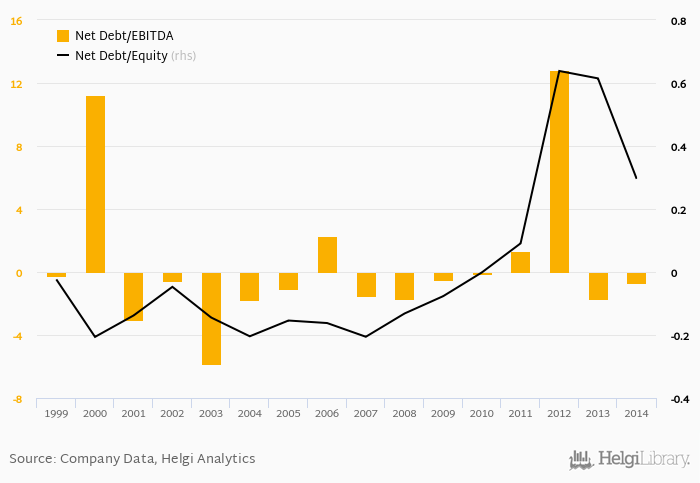
Synergon's net debt stood at HUF 399 mil and accounted for 0.296 of equity at the end of 2014. The ratio is down 0.319 pp compared to the previous year.
Historically, the firm’s net debt to equity reached a high of 0.638 in 2012 and a low of -0.206 in 2000 between 1999 and 2014. The average for the last five years was 0.328%.
Net debt to EBITDA was calculated at -0.704x at the end of the year. That is down from -0.490x seen in 2009. The ratio reached a high of 12.9x in 2012 and a low of -5.86x in 2003.
The company’s cost of funding amounted to 4.98% in 2014, down which is above the 5-year of 24.2%. Funding costs have “eaten” some 9.23% of the operating profit generated in 2019.
You can see all the company’s data at Synergon profile, or you can download a report on the company in the report section.
 Helgi Library