Follow us for the latest automotive news.
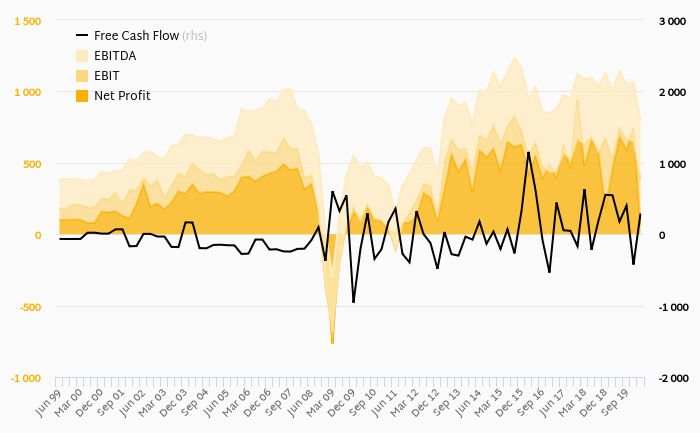
Toyota Motor Corporation's operating cash flow stood at JPY 702 bil in 1Q2020, down 22% when compared to the previous year. Historically, between 2Q1999 - 1Q2020, the firm’s operating cash flow reached a high of JPY 1,395 bil in 1Q2016 and a low of JPY -387 bil in 4Q2008.
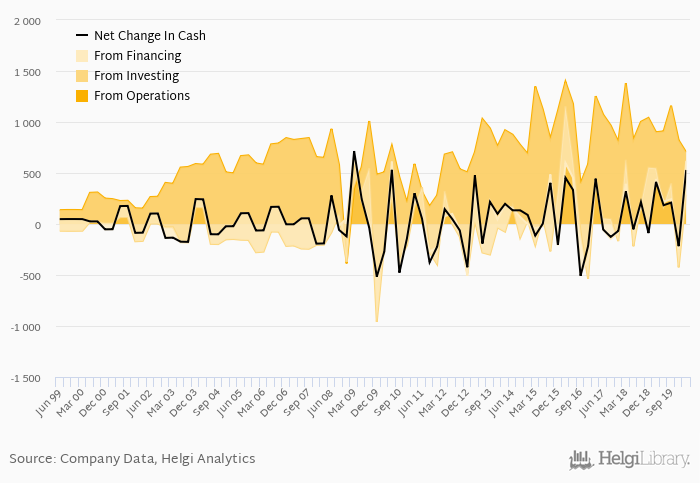
Toyota Motor Corporation's total investments stood at JPY -413 bil and accounted for 4.62% of sales in 1Q2020. This is compared to an average of 4.39% as seen over the last five years.
Cash from financing amounted to JPY 331 bil, so the company generated JPY 530 bil net cash in 1Q2020.
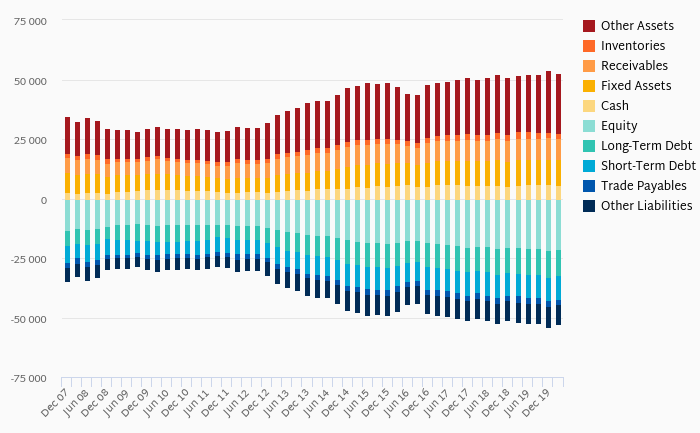
At the end of 1Q2020, the company had a net debt of JPY 15,133 bil, or 3.74x of EBITDA and 71.2% of equity. Net working capital amounted to JPY 8,710 bil, or 123% of sales. Cash conversion cycle is negative and reached 106 days days in 1Q2020. This means Toyota Motor Corporation generates revenue from customers before it has to pay its suppliers for inventory, among other things.
You can see all the company’s data at Toyota Motor Corporation profile, or you can download a report on the company in the report section.
 Helgi Library