
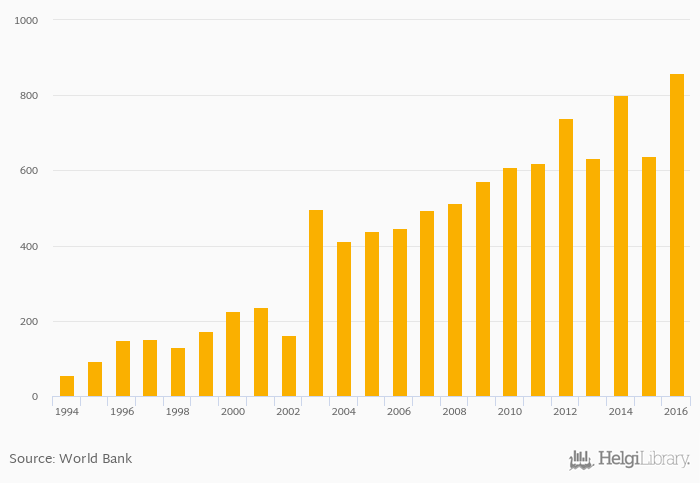
Trademark applications (direct resident) rose 34.8% to 860 in Madagascar in 2016, according to World Bank.
Historically, trademark applications (direct resident) in Madagascar reached an all time high of 860 in 2016 and an all time low of 57.0 in 1994.
Madagascar has been ranked 88th within the group of 113 countries we follow in terms of trademark applications (direct resident), 1 place below the position seen 10 years ago.
| Trademark Applications (Direct Resident) | Unit | 1999 | 2000 | 2001 | 2002 | 2003 | 2004 | 2005 | 2006 | 2007 | 2008 | 2009 | 2010 | 2011 | 2012 | 2013 | 2014 | 2015 | 2016 | 2017 | 2018 | 2019 |
| Botswana | ... | ... | ... | ... | ... | ... | ... | ... | ... | ... | ... | ... | 358 | 359 | 418 | 519 | 464 | |||||
| Kenya | ... | 2,816 | 1.00 | 3,437 | ... | 3,675 | ... | |||||||||||||||
| Lesotho | ... | ... | ... | ... | ... | ... | ... | ... | ... | ... | ... | ... | ... | ... | ... | ... | ... | ... | ... | ... | ||
| Madagascar | 633 | 800 | 638 | 860 | 855 | |||||||||||||||||
| Malawi | 334 | 393 | 428 | 499 | ... | ... | ... | |||||||||||||||
| Mozambique | 1,112 | 1,274 | 1,157 | 1,295 | 1,278 | |||||||||||||||||
| Namibia | ... | ... | ... | ... | ... | ... | ... | ... | ... | ... | ... | ... | ... | 332 | 364 | 1,608 | 739 | 3,423 | ||||
| South Africa | 20,871 | 20,475 | 21,594 | 22,676 | 22,381 | |||||||||||||||||
| Swaziland | ... | ... | ... | ... | ... | ... | ... | ... | ... | ... | ... | ... | ... | ... | ... | ... | ... | ... | ... | ... | ... | |
| Tanzania | ... | ... | ... | ... | ... | ... | ... | ... | ... | ... | ... | ... | ||||||||||
| Uganda | ... | ... | ... | ... | 725 | 1,076 | 1,046 | 1,291 | 1,359 | ... | ... | |||||||||||
| Zambia | ... | 398 | 527 | 682 | 793 | 1,072 |
 Helgi Library


