
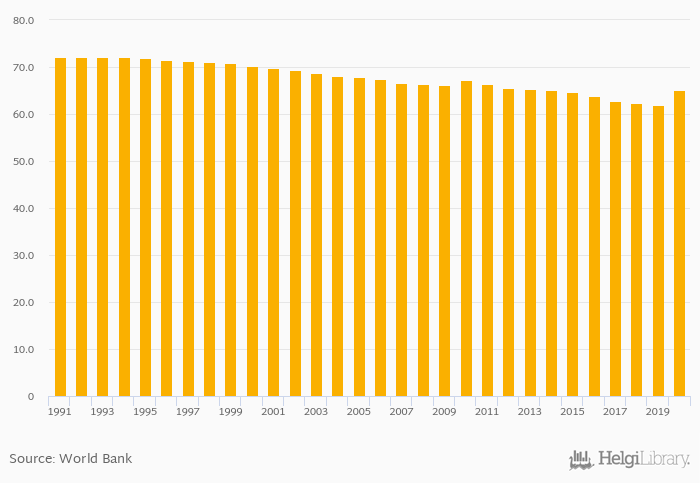
Vulnerable Employment, Female (As % of Female Employment) rose 5.21% to 65.1% in Sudan in 2020, according to World Bank.
Historically, Vulnerable Employment, Female (As % of Female Employment) in Sudan reached an all time high of 72.1% in 1991 and an all time low of 61.9% in 2019. When compared to Sudan's main peers, Vulnerable Employment, Female (As % of Female Employment) in Chad amounted to 98.8%, 31.9% in Egypt, 88.8% in Ethiopia and 90.7% in South Sudan in 2020.
Sudan has been ranked 50th within the group of 173 countries we follow in terms of Vulnerable Employment, Female (As % of Female Employment), 1 place above the position seen 10 years ago.
| Vulnerable Employment, Female (As % of Female Employment) | Unit | 2000 | 2001 | 2002 | 2003 | 2004 | 2005 | 2006 | 2007 | 2008 | 2009 | 2010 | 2011 | 2012 | 2013 | 2014 | 2015 | 2016 | 2017 | 2018 | 2019 | 2020 |
| Cameroon | % | 84.0% | 83.6% | 83.0% | 82.1% | 81.4% | ||||||||||||||||
| Central African Republic | % | 96.4% | 96.5% | 96.6% | 96.5% | 96.5% | ||||||||||||||||
| Chad | % | 98.2% | 98.2% | 98.6% | 98.8% | 98.8% | ||||||||||||||||
| Egypt | % | 46.6% | 46.5% | 31.6% | 35.0% | 30.9% | ||||||||||||||||
| Eritrea | % | 84.7% | 85.5% | 84.9% | 85.8% | 84.9% | ||||||||||||||||
| Ethiopia | % | 90.1% | 89.4% | 88.7% | 88.0% | 87.1% | ||||||||||||||||
| Israel | % | 6.87% | 6.91% | 7.07% | 6.90% | 7.55% | ||||||||||||||||
| Kenya | % | 63.7% | 62.0% | 60.5% | 59.3% | 58.2% | ||||||||||||||||
| Libya | % | 32.8% | 33.6% | 34.1% | 34.0% | 33.7% | ||||||||||||||||
| Niger | % | 97.6% | 97.7% | 97.9% | 97.9% | 98.0% | ||||||||||||||||
| Nigeria | % | 86.9% | 87.4% | 87.5% | 86.6% | 85.7% | ||||||||||||||||
| Saudi Arabia | % | 0.990% | 1.15% | 1.08% | 1.10% | 1.11% | ||||||||||||||||
| Somalia | % | 95.9% | 96.0% | 96.1% | 96.3% | 96.4% | ||||||||||||||||
| South Sudan | % | 95.7% | 95.6% | 95.6% | 95.5% | 95.4% | ||||||||||||||||
| Sudan | % | 65.0% | 64.7% | 63.8% | 62.8% | 62.3% | ||||||||||||||||
| Uganda | % | 82.3% | 81.9% | 81.2% | 81.1% | 80.5% |
 Helgi Library


