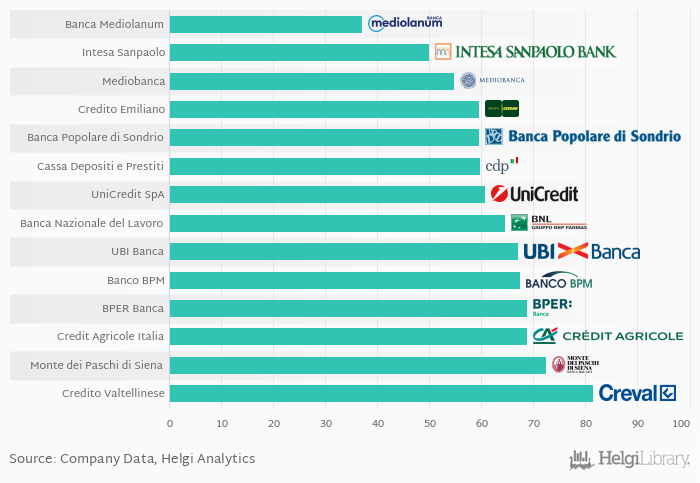
Based on a comparison of 14 banks in Italy in 2018, Banca Mediolanum was the most cost efficient bank, followed by Intesa Sanpaolo and Mediobanca.
Banca Mediolanum's cost to income ratio reached 37.1% in 2018, down from 35.2% when compared to the last year. Historically, the bank’s costs reached an all time high of 2,546% in 2001 and an all time low of -1,574% in 2002.
When compared to total assets, bank's cost amounted to 1.39% in 2018, down from 6.57% a year earlier.
Comparing Banca Mediolanum with its closest peers, Intesa Sanpaolo operated in 2018 with a cost to income ratio of 50.0%, Mediobanca reached 54.7% and Banca Popolare di Sondrio some 59.6%.
You can see all the banks cost efficiency data on the Costs (As % Of Income) indicator page or you can download a report on the Italian banks in the report section.
Costs (As % Of Income) | Unit | 1970 | 1971 | 1972 | 1973 | 1974 | 1975 | 1976 | 1977 | 1978 | 1979 | 1980 | 1981 | 1982 | 1983 | 1984 | 1985 | 1986 | 1987 | 1988 | 1989 | 1990 | 1991 | 1992 | 1993 | 1994 | 1995 | 1996 | 1997 | 1998 | 1999 | 2000 | 2001 | 2002 | 2003 | 2004 | 2005 | 2006 | 2007 | 2008 | 2009 | 2010 | 2011 | 2012 | 2013 | 2014 | 2015 | 2016 | 2017 | 2018 | 2019 |
Banca Mediolanum | % | ... | ... | ... | ... | ... | ... | ... | ... | ... | ... | ... | ... | ... | ... | ... | ... | ... | ... | ... | ... | ... | ... | ... | 29.3% | 34.7% | 33.5% | 34.2% | 35.2% | ||||||||||||||||||||||
Banca Nazionale del Lavoro | % | ... | ... | ... | ... | ... | ... | ... | ... | ... | ... | ... | ... | ... | ... | ... | ... | ... | ... | ... | ... | ... | 62.2% | 61.5% | 61.3% | 62.3% | 66.4% | ... | |||||||||||||||||||||||
Banca Popolare di Sondrio | % | ... | ... | ... | ... | ... | ... | ... | ... | ... | ... | ... | ... | ... | ... | ... | ... | ... | ... | ... | ... | 43.7% | 41.5% | 48.0% | 54.9% | 50.8% | |||||||||||||||||||||||||
Banco BPM | % | ... | ... | ... | ... | ... | ... | ... | ... | ... | ... | ... | ... | ... | ... | ... | ... | ... | ... | ... | ... | ... | ... | ... | ... | ... | ... | ... | ... | ... | ... | ... | ... | ... | ... | ... | ... | 69.0% | 66.6% | 67.1% | 71.7% | 102% | |||||||||
BPER Banca | % | ... | ... | ... | ... | ... | ... | ... | ... | ... | ... | ... | ... | ... | ... | ... | ... | ... | ... | 58.0% | 57.7% | 53.6% | 65.6% | 67.1% | |||||||||||||||||||||||||||
Cassa Depositi e Prestiti | % | ... | ... | ... | ... | ... | ... | ... | ... | ... | ... | ... | ... | ... | ... | ... | ... | ... | ... | ... | ... | ... | ... | ... | ... | ... | ... | ... | ... | ... | ... | ... | ... | ... | ... | ... | ... | ... | ... | 52.3% | 63.7% | 67.7% | 68.1% | 61.4% | ... | ||||||
Credit Agricole Italia | % | ... | ... | ... | ... | ... | ... | ... | ... | ... | ... | ... | ... | ... | ... | ... | ... | ... | ... | ... | ... | ... | ... | ... | ... | ... | ... | ... | ... | ... | ... | ... | ... | ... | ... | ... | ... | ... | ... | 63.4% | 63.2% | 65.5% | 70.3% | 76.8% | ... | ||||||
Credito Emiliano | % | ... | ... | ... | ... | ... | ... | ... | ... | ... | ... | ... | ... | ... | ... | ... | ... | ... | ... | ... | ... | 43.7% | 41.5% | 48.0% | 54.9% | 50.8% | |||||||||||||||||||||||||
Credito Valtellinese | % | ... | ... | ... | ... | ... | ... | ... | ... | ... | ... | ... | ... | ... | ... | ... | ... | ... | ... | ... | ... | 62.5% | 63.0% | 63.7% | 74.1% | 104% | |||||||||||||||||||||||||
Intesa Sanpaolo | % | ... | ... | ... | ... | ... | ... | ... | ... | ... | ... | ... | ... | ... | ... | ... | ... | ... | ... | 51.8% | 55.0% | 54.0% | 50.3% | 47.9% | |||||||||||||||||||||||||||
Mediobanca | % | ... | ... | ... | ... | ... | ... | ... | ... | ... | ... | ... | ... | ... | ... | ... | ... | ... | ... | 52.6% | 46.0% | 46.3% | 51.2% | 54.7% | |||||||||||||||||||||||||||
Monte dei Paschi di Siena | % | ... | ... | ... | ... | ... | ... | ... | ... | ... | ... | ... | ... | ... | ... | ... | ... | ... | ... | ... | ... | ... | ... | ... | ... | ... | ... | 72.2% | 67.3% | 54.7% | 71.7% | 70.7% | |||||||||||||||||||
UBI Banca | % | ... | ... | ... | ... | ... | ... | ... | ... | ... | ... | ... | ... | ... | ... | ... | ... | ... | ... | ... | ... | ... | ... | ... | ... | ... | ... | ... | ... | ... | ... | ... | ... | 63.9% | 67.5% | 66.4% | 66.7% | 65.7% | |||||||||||||
UniCredit SpA | % | ... | ... | ... | ... | ... | ... | ... | ... | ... | ... | ... | ... | ... | ... | ... | ... | ... | ... | 70.9% | 63.3% | 74.8% | 9.22% | 80.9% | |||||||||||||||||||||||||||
AVERAGE | % | ... | ... | ... | ... | ... | ... | ... | ... | ... | ... | ... | ... | ... | ... | ... | ... | ... | ... | 70.4% | 66.6% | 61.1% | 62.6% | 64.1% | 61.4% | 67.1% | 65.7% | 65.9% | 78.3% | 62.4% | 76.4% | 222% | 314% | -71.8% | 94.2% | 57.4% | 54.9% | 51.9% | 52.9% | 61.8% | 54.1% | 58.8% | 59.1% | 54.8% | 56.8% | 56.6% | 57.5% | 57.5% | 66.8% | 62.3% | 58.6% |