
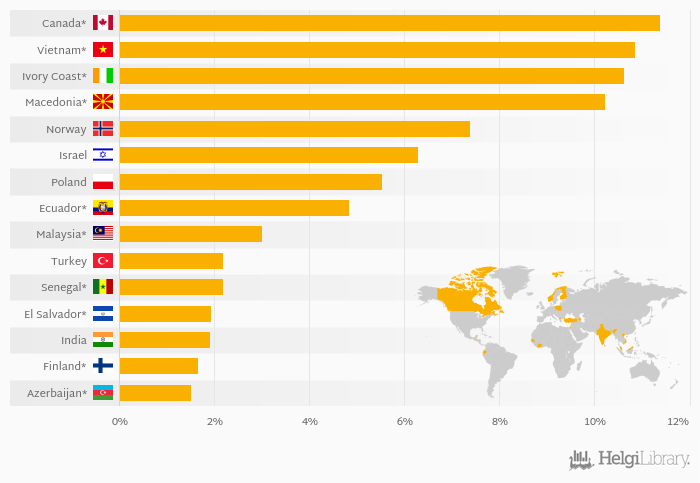
Based on a comparison of 63 countries in 2020, Canada ranked the highest in industrial production growth with 11.4% followed by Vietnam and Ivory Coast. On the other end of the scale was Macao with -22.3%, Luxembourg with -10.7% and France with -10.5%.
Data for more countries are available at Industrial Production Growth indicator page.
| Industrial Production Growth | Unit | 2000 | 2001 | 2002 | 2003 | 2004 | 2005 | 2006 | 2007 | 2008 | 2009 | 2010 | 2011 | 2012 | 2013 | 2014 | 2015 | 2016 | 2017 | 2018 | 2019 | 2020 |
| Azerbaijan | % | -0.688% | 2.40% | -0.520% | -3.40% | 1.52% | ... | ... | ||||||||||||||
| Canada | % | 4.97% | -0.474% | -0.087% | 5.48% | 3.31% | ... | |||||||||||||||
| Ecuador | % | ... | 1.36% | -0.662% | 4.47% | 2.65% | 1.36% | ... | ||||||||||||||
| El Salvador | % | 2.74% | 2.11% | 0.372% | 1.94% | 1.94% | ... | ... | ||||||||||||||
| Finland | % | -1.81% | -0.917% | 4.15% | 3.22% | 3.66% | ... | |||||||||||||||
| India | % | 1.36% | -0.662% | 4.47% | 2.65% | 1.36% | ||||||||||||||||
| Israel | % | 1.18% | 2.24% | 1.66% | 3.65% | 4.42% | ||||||||||||||||
| Ivory Coast | % | 2.92% | 7.56% | 6.94% | 5.42% | 10.6% | ... | ... | ||||||||||||||
| Macedonia | % | 4.79% | 4.91% | 3.37% | 0.202% | 5.38% | ... | |||||||||||||||
| Malaysia | % | 5.18% | 4.72% | 4.12% | 4.45% | 3.01% | ... | ... | ||||||||||||||
| Norway | % | 2.14% | 1.46% | -1.21% | -0.295% | -1.84% | ||||||||||||||||
| Poland | % | 5.90% | 6.12% | 3.40% | 9.07% | 1.09% | ||||||||||||||||
| Senegal | % | 0.061% | 6.20% | 5.45% | 2.29% | 1.11% | ... | |||||||||||||||
| Turkey | % | 5.90% | 6.12% | 3.40% | 9.07% | 1.09% | ||||||||||||||||
| Vietnam | % | ... | ... | ... | ... | ... | ... | ... | ... | ... | 7.43% | 11.9% | 16.5% | -29.3% | 10.9% | ... | ... |
 Helgi Library


