
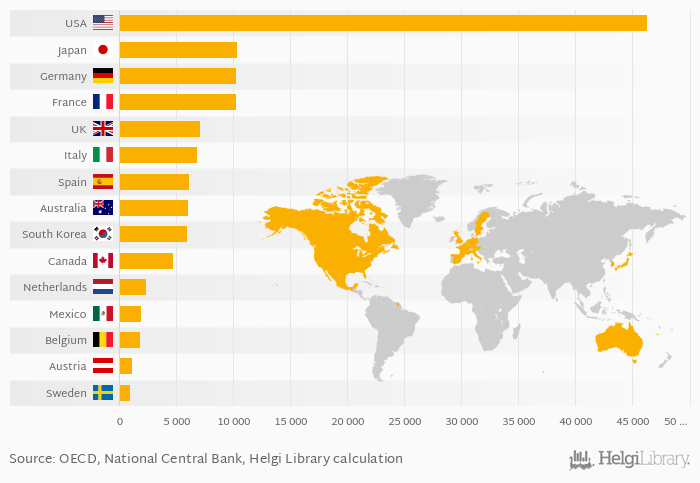
Based on a comparison of 25 countries in 2020, USA ranked the highest in households' non-financial assets with USD 46,301 bil followed by Japan and Germany. On the other end of the scale was Estonia with USD 40.9 bil, Lithuania with USD 68.1 bil and Slovenia with USD 98.5 bil.
Data for more countries are available at Households' Non-Financial Assets (USD) indicator page.
| Households' Non-Financial Assets (USD) | Unit | 2000 | 2001 | 2002 | 2003 | 2004 | 2005 | 2006 | 2007 | 2008 | 2009 | 2010 | 2011 | 2012 | 2013 | 2014 | 2015 | 2016 | 2017 | 2018 | 2019 | 2020 |
| Australia | USD bil | 5,186 | 4,552 | 4,999 | 5,207 | 4,949 | ||||||||||||||||
| Austria | USD bil | 999 | 886 | 897 | 946 | 1,041 | ||||||||||||||||
| Belgium | USD bil | 1,707 | 1,502 | 1,513 | 1,577 | 1,710 | ||||||||||||||||
| Canada | USD bil | 4,061 | 3,765 | 3,934 | 4,211 | 4,227 | ||||||||||||||||
| France | USD bil | 8,693 | 7,331 | 7,549 | 8,016 | 8,789 | ||||||||||||||||
| Germany | USD bil | 8,673 | 7,523 | 7,761 | 8,274 | 9,199 | ||||||||||||||||
| Italy | USD bil | 8,101 | 6,622 | 6,530 | 6,592 | 6,848 | ||||||||||||||||
| Japan | USD bil | 10,289 | 9,005 | 10,133 | 9,924 | 9,981 | ||||||||||||||||
| Mexico | USD bil | ... | ... | ... | 1,892 | 1,732 | 1,678 | 1,893 | 2,063 | |||||||||||||
| Netherlands | USD bil | 1,761 | 1,520 | 1,602 | 1,759 | 2,028 | ||||||||||||||||
| South Korea | USD bil | 4,534 | 4,441 | 4,576 | 5,017 | 5,565 | ||||||||||||||||
| Spain | USD bil | 5,514 | 4,858 | 5,081 | 5,541 | 6,080 | ||||||||||||||||
| Sweden | USD bil | 792 | 724 | 787 | 842 | 861 | ||||||||||||||||
| USA | USD bil | 30,925 | 33,225 | 35,259 | 37,886 | 39,830 | ||||||||||||||||
| United Kingdom | USD bil | 7,057 | 7,067 | 6,580 | 6,520 | 6,813 |
 Helgi Library


