
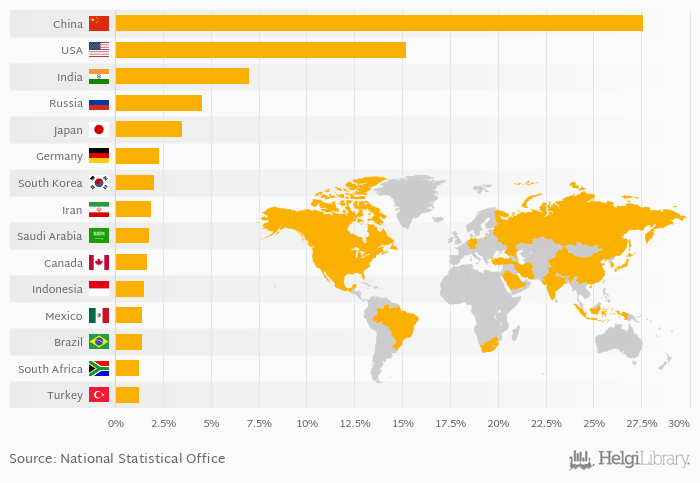
Based on a comparison of 79 countries in 2017, China ranked the highest in CO2 emissions as a share of total worldwide CO2 emissions with 27.6% followed by USA and India. On the other end of the scale was Iceland with 0.009%, Macedonia with 0.020% and Latvia with 0.024%.
Data for more countries are available at CO2 Emissions (As % of Total Worldwide CO2 Emissions) indicator page.
| CO2 Emissions (As % of Total Worldwide CO2 Emissions) | Unit | 1997 | 1998 | 1999 | 2000 | 2001 | 2002 | 2003 | 2004 | 2005 | 2006 | 2007 | 2008 | 2009 | 2010 | 2011 | 2012 | 2013 | 2014 | 2015 | 2016 | 2017 |
| Brazil | % | 1.33% | 1.39% | 1.49% | 1.56% | 1.51% | ||||||||||||||||
| Canada | % | 1.66% | 1.59% | 1.61% | 1.64% | 1.61% | ||||||||||||||||
| China | % | 27.5% | 27.7% | 28.1% | 28.0% | 27.9% | ||||||||||||||||
| Germany | % | 2.38% | 2.38% | 2.42% | 2.28% | 2.29% | ||||||||||||||||
| India | % | 5.43% | 5.73% | 5.89% | 6.34% | 6.53% | ||||||||||||||||
| Indonesia | % | 1.50% | 1.58% | 1.60% | 1.45% | 1.48% | ||||||||||||||||
| Iran | % | 1.70% | 1.69% | 1.75% | 1.83% | 1.81% | ||||||||||||||||
| Japan | % | 3.73% | 3.97% | 3.89% | 3.75% | 3.64% | ||||||||||||||||
| Mexico | % | 1.46% | 1.47% | 1.45% | 1.40% | 1.39% | ||||||||||||||||
| Russia | % | 4.87% | 4.86% | 4.65% | 4.66% | 4.55% | ||||||||||||||||
| Saudi Arabia | % | 1.57% | 1.63% | 1.63% | 1.73% | 1.79% | ||||||||||||||||
| South Africa | % | 1.38% | 1.35% | 1.33% | 1.34% | 1.28% | ||||||||||||||||
| South Korea | % | 2.02% | 1.99% | 1.97% | 1.96% | 2.00% | ||||||||||||||||
| Turkey | % | 0.943% | 0.981% | 0.931% | 1.03% | 1.06% | ||||||||||||||||
| USA | % | 16.8% | 16.0% | 16.2% | 16.3% | 15.9% |
 Helgi Library


