
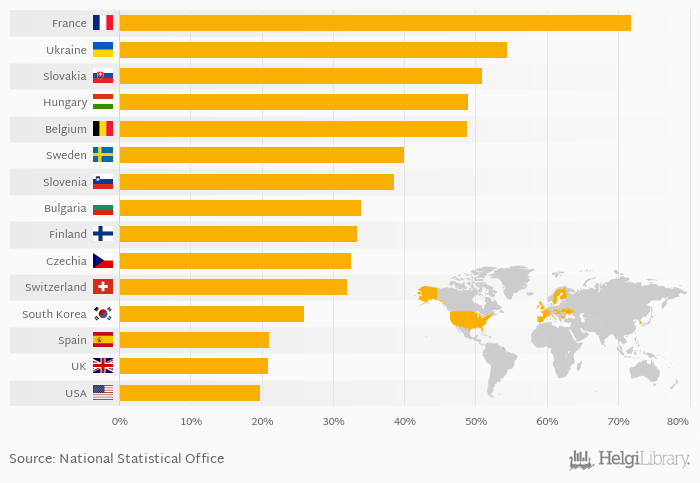
Based on a comparison of 31 countries in 2017, France ranked the highest in electricity production from nuclear sources as a percentage of total with 71.9% followed by Ukraine and Slovakia. On the other end of the scale was Kazakhstan with 0%, Lithuania with 0% and Iran with 2.32%.
Average electricity production from nuclear sources as a percentage of total reached 10.3% in 2017 in the World according to World Bank / EIA. This is 1.61 % less than in the previous year and -32.5 % less than 10 years ago.
Historically, average electricity production from nuclear sources as a percentage of total reached an all time high of 17.6% in 1996 and an all time low of 2.00% in 1971. The average annual growth amounted to 3.63 % since 1960.
Data for more countries are available at Electricity Production from Nuclear Sources (As % of Total) indicator page.
| Electricity Production from Nuclear Sources (As % of Total) | Unit | 1997 | 1998 | 1999 | 2000 | 2001 | 2002 | 2003 | 2004 | 2005 | 2006 | 2007 | 2008 | 2009 | 2010 | 2011 | 2012 | 2013 | 2014 | 2015 | 2016 | 2017 |
| Belgium | % | 54.2% | 49.4% | 51.9% | 47.1% | 37.5% | ||||||||||||||||
| Bulgaria | % | 32.6% | 33.9% | 32.9% | 33.8% | 31.2% | ||||||||||||||||
| Czechia | % | 32.6% | 35.0% | 35.7% | 35.6% | 32.5% | ||||||||||||||||
| Finland | % | 31.5% | 32.6% | 33.1% | 34.6% | 33.9% | ||||||||||||||||
| France | % | 79.5% | 76.0% | 74.7% | 78.2% | 77.6% | ||||||||||||||||
| Hungary | % | 43.5% | 45.6% | 50.7% | 53.2% | 52.2% | ||||||||||||||||
| Slovakia | % | 54.5% | 54.7% | 55.1% | 57.1% | 56.9% | ||||||||||||||||
| Slovenia | % | 39.1% | 35.6% | 33.5% | 37.1% | 38.1% | ||||||||||||||||
| South Korea | % | 29.8% | 28.3% | 25.8% | 28.7% | 30.0% | ||||||||||||||||
| Spain | % | 19.8% | 20.9% | 20.2% | 20.8% | 20.6% | ||||||||||||||||
| Sweden | % | 40.2% | 38.5% | 43.4% | 42.3% | 34.7% | ||||||||||||||||
| Switzerland | % | 42.5% | 37.3% | 37.8% | 39.3% | 34.9% | ||||||||||||||||
| USA | % | 19.0% | 18.8% | 19.2% | 19.2% | 19.3% | ||||||||||||||||
| Ukraine | % | 46.3% | 45.4% | 43.0% | 48.6% | 53.5% | ||||||||||||||||
| United Kingdom | % | 19.0% | 19.6% | 19.9% | 19.0% | 20.9% |
 Helgi Library


