
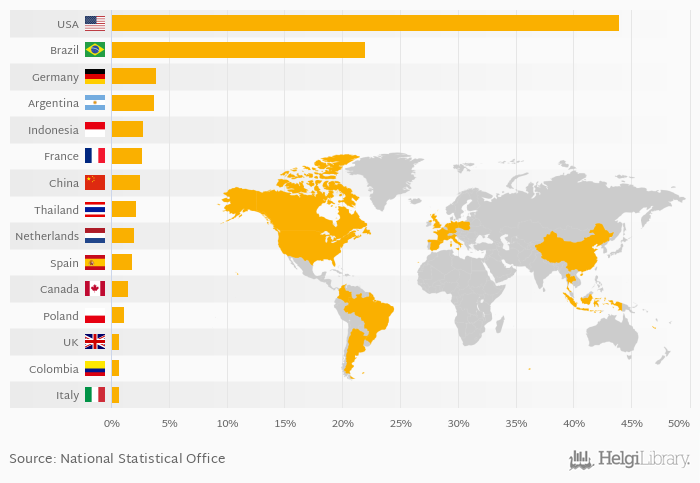
Based on a comparison of 24 countries in 2017, USA ranked the highest in biofuels production as a share of worldwide production with 43.9% followed by Brazil and Germany. On the other end of the scale was Mexico with 0.017%, Australia with 0.171% and Sweden with 0.220%.
Data for more countries are available at Biofuels Production (As % of Worldwide Production) indicator page.
| Biofuels Production (As % of Worldwide Production) | Unit | 1997 | 1998 | 1999 | 2000 | 2001 | 2002 | 2003 | 2004 | 2005 | 2006 | 2007 | 2008 | 2009 | 2010 | 2011 | 2012 | 2013 | 2014 | 2015 | 2016 | 2017 |
| Argentina | % | ... | ... | ... | 3.40% | 3.43% | 2.78% | 3.30% | 2.55% | |||||||||||||
| Brazil | % | 21.9% | 22.0% | 23.6% | 22.5% | 24.2% | ||||||||||||||||
| Canada | % | ... | ... | 1.37% | 1.50% | 1.46% | 1.49% | 1.43% | ||||||||||||||
| China | % | ... | ... | ... | ... | 3.00% | 3.15% | 3.24% | 3.26% | 3.32% | ||||||||||||
| Colombia | % | ... | ... | ... | ... | ... | ... | ... | ... | 0.872% | 0.939% | 0.897% | 0.845% | 0.868% | ||||||||
| France | % | 2.95% | 3.21% | 3.18% | 3.22% | 3.20% | ||||||||||||||||
| Germany | % | 4.52% | 4.53% | 3.83% | 4.32% | 4.00% | ||||||||||||||||
| Indonesia | % | ... | ... | ... | ... | ... | ... | ... | ... | 1.69% | 2.09% | 2.42% | 3.89% | 1.65% | ||||||||
| Italy | % | 0.741% | 0.446% | 0.627% | 0.719% | 0.716% | ||||||||||||||||
| Netherlands | % | ... | ... | ... | ... | ... | ... | ... | 1.03% | 1.91% | 2.06% | 2.47% | 2.27% | |||||||||
| Poland | % | ... | ... | ... | ... | ... | ... | 0.630% | 0.975% | 0.962% | 0.937% | 1.18% | ||||||||||
| Spain | % | 1.30% | 0.927% | 1.03% | 1.29% | 1.40% | ||||||||||||||||
| Thailand | % | ... | ... | ... | ... | ... | ... | ... | 1.16% | 1.58% | 1.84% | 1.86% | 2.01% | |||||||||
| USA | % | 47.5% | 44.6% | 42.9% | 41.1% | 42.4% | ||||||||||||||||
| United Kingdom | % | ... | ... | ... | ... | ... | 0.490% | 0.453% | 0.714% | 0.504% | 0.388% |
 Helgi Library


