
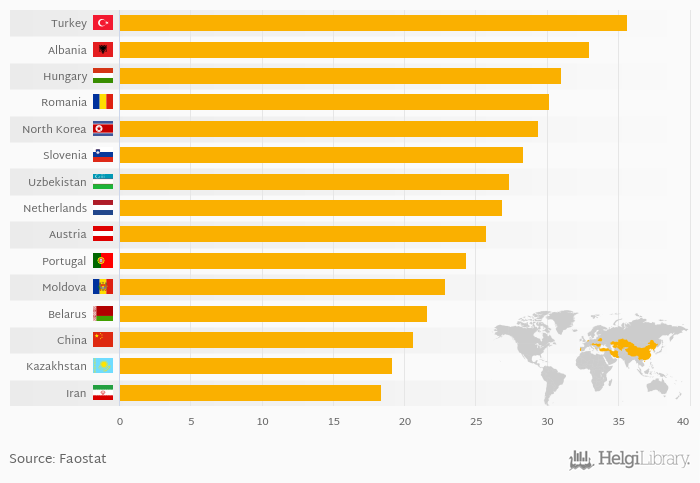
Based on a comparison of 165 countries in 2020, Turkey ranked the highest in apple consumption per capita with 35.7 kg followed by Albania and Hungary. On the other end of the scale was Chad with 0.010 kg, Burundi with 0.010 kg and Ethiopia with 0.020 kg.
Average apple consumption per capita reached 8.53 kg in 2020 in the World according to Faostat. This is 4.81 % less than in the previous year and 0.469 % more than 10 years ago.
Historically, average apple consumption per capita reached an all time high of 9.09 kg in 2008 and an all time low of 4.29 kg in 1961. The average annual growth amounted to 1.17 % since 1961.
Data for more countries are available at Apple Consumption Per Capita indicator page.
| Apple Consumption Per Capita | Unit | 2001 | 2002 | 2003 | 2004 | 2005 | 2006 | 2007 | 2008 | 2009 | 2010 | 2011 | 2012 | 2013 | 2014 | 2015 | 2016 | 2017 | 2018 | 2019 | 2020 | 2021 |
| Albania | kg | 29.6 | 33.0 | 32.5 | 34.6 | 32.7 | ||||||||||||||||
| Austria | kg | 30.3 | 20.6 | 20.9 | 31.2 | 21.0 | ||||||||||||||||
| Belarus | kg | 23.6 | 23.2 | 25.7 | 24.5 | 20.9 | ||||||||||||||||
| China | kg | 21.5 | 22.1 | 22.1 | 20.1 | 22.1 | ||||||||||||||||
| Dem. People's Republic of Korea | kg | 28.5 | 29.3 | 28.3 | 28.0 | 30.5 | ||||||||||||||||
| Hungary | kg | 27.3 | 25.3 | 25.5 | 26.7 | 35.1 | ||||||||||||||||
| Iran | kg | 23.1 | 18.3 | 17.4 | 14.8 | 17.2 | ||||||||||||||||
| Kazakhstan | kg | 21.1 | 21.0 | 21.5 | 21.8 | 22.5 | ||||||||||||||||
| Moldova | kg | 5.56 | 6.59 | 5.33 | 6.71 | 11.3 | ||||||||||||||||
| Netherlands | kg | 42.9 | 43.1 | 43.3 | 43.4 | 42.3 | ||||||||||||||||
| Portugal | kg | 23.9 | 24.0 | 23.8 | 24.8 | 30.1 | ||||||||||||||||
| Romania | kg | 24.5 | 25.1 | 24.3 | 26.1 | 28.2 | ||||||||||||||||
| Slovenia | kg | 33.0 | 28.2 | 32.4 | 32.7 | 24.4 | ||||||||||||||||
| Turkey | kg | 27.3 | 28.8 | 28.9 | 33.5 | 30.5 | ||||||||||||||||
| Uzbekistan | kg | 22.9 | 23.6 | 24.2 | 27.2 | 27.8 |
 Helgi Library


