
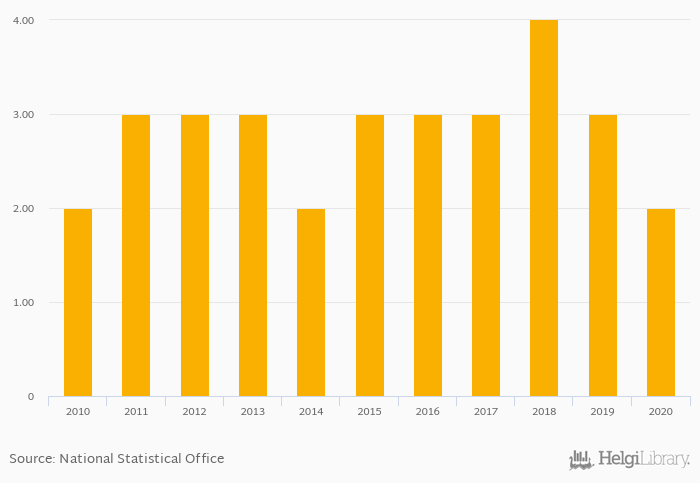
Total wine consumption fell 33.3% to 2.00 Ml in India in 2020, according to Faostat.
Historically, total wine consumption in India reached an all time high of 4.00 Ml in 2018 and an all time low of 2.00 Ml in 2014.
India has been ranked 104th within the group of 138 countries we follow in terms of total wine consumption, 9 places above the position seen 10 years ago.
| Wine Consumption (Total) | Unit | 2001 | 2002 | 2003 | 2004 | 2005 | 2006 | 2007 | 2008 | 2009 | 2010 | 2011 | 2012 | 2013 | 2014 | 2015 | 2016 | 2017 | 2018 | 2019 | 2020 | 2021 |
| Afghanistan | Ml | ... | ... | ... | ... | ... | ... | ... | ... | ... | ... | ... | ... | ... | ||||||||
| Bangladesh | Ml | ... | ... | ... | ... | ... | ... | ... | ... | ... | ... | ... | ... | ... | ... | ... | ... | ... | ... | ... | ... | ... |
| Bhutan | Ml | ... | ... | ... | ... | ... | ... | ... | ... | |||||||||||||
| China | Ml | 2,787 | 2,802 | 3,005 | 2,907 | 2,676 | ||||||||||||||||
| India | Ml | ... | ... | ... | ... | ... | ... | ... | ... | ... | 3.00 | 3.00 | 3.00 | 4.00 | 3.00 | |||||||
| Iran | Ml | ... | ... | ... | ... | ... | ... | ... | ... | ... | ... | ... | ... | ... | ... | ... | ... | ... | ... | ... | ... | ... |
| Japan | Ml | 347 | 352 | 360 | 363 | 376 | ||||||||||||||||
| Malaysia | Ml | 6.00 | 8.00 | 8.00 | 8.00 | 7.00 | ||||||||||||||||
| Maldives | Ml | 1.00 | 2.00 | 2.00 | 2.00 | 2.00 | ||||||||||||||||
| Myanmar | Ml | ... | ... | ... | ... | -52.0 | 1.00 | 3.00 | 2.00 | |||||||||||||
| Pakistan | Ml | ... | ... | ... | ... | ... | ... | ... | ... | ... | ... | ... | ... | ... | ... | ... | ... | ... | ... | ... | ... | ... |
| Russia | Ml | 1,079 | 1,106 | 1,148 | 1,064 | 1,177 | ||||||||||||||||
| Sri Lanka | Ml | 1.00 | 2.00 | 1.00 | 2.00 | 1.00 | ||||||||||||||||
| USA | Ml | 3,975 | 4,019 | 3,454 | 3,041 | 3,097 |
 Helgi Library


