
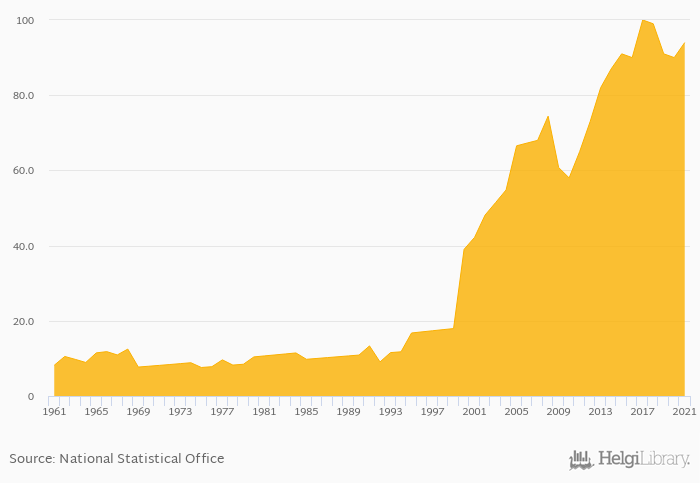
Total wine consumption rose 4.44% to 94.0 Ml in Peru in 2021, according to Faostat.
Historically, total wine consumption in Peru reached an all time high of 100 Ml in 2017 and an all time low of 7.58 Ml in 1975. When compared to Peru's main peers, total wine consumption in Bolivia amounted to 10.0 Ml, 512 Ml in Brazil, 207 Ml in Chile and 28.0 Ml in Colombia in 2021.
Peru has been ranked 32nd within the group of 140 countries we follow in terms of total wine consumption, 7 places above the position seen 10 years ago.
| Wine Consumption (Total) | Unit | 2001 | 2002 | 2003 | 2004 | 2005 | 2006 | 2007 | 2008 | 2009 | 2010 | 2011 | 2012 | 2013 | 2014 | 2015 | 2016 | 2017 | 2018 | 2019 | 2020 | 2021 |
| Argentina | Ml | 1,082 | 1,036 | 1,037 | 1,106 | 1,005 | ||||||||||||||||
| Bolivia | Ml | 9.00 | 9.00 | 9.00 | 7.00 | 9.00 | ||||||||||||||||
| Brazil | Ml | 366 | 221 | 353 | 360 | 495 | ||||||||||||||||
| Chile | Ml | 283 | 230 | 221 | 287 | 337 | ||||||||||||||||
| Colombia | Ml | 27.0 | 25.0 | 21.0 | 24.0 | 23.0 | ||||||||||||||||
| Paraguay | Ml | 17.0 | 25.0 | 25.0 | 26.0 | 25.0 | ||||||||||||||||
| Peru | Ml | 91.0 | 90.0 | 100 | 99.0 | 91.0 | ||||||||||||||||
| Uruguay | Ml | 67.0 | 67.0 | 65.0 | 60.0 | 61.0 | ||||||||||||||||
| Venezuela | Ml | 5.00 | 1.00 | 2.00 | 2.00 | 6.00 |
 Helgi Library


