By Helgi Library - November 4, 2020
Airbus made a net profit of EUR -767 mil with revenues of EUR 11,213 mil in 3Q2020, down by 178% and down by 26.7%, r...
By Helgi Library - November 4, 2020
Airbus stock traded at EUR 68.6 per share at the end 3Q2020 translating into a market capitalization of USD 57,016 mil. Since the...
By Helgi Library - November 4, 2020
Airbus's total assets reached EUR 113,306 mil at the end of 3Q2020, down 0.871% compared to the previous year. Cur...
| Profit Statement | 2023 | 2024 | 2025 | |
| Sales | EUR mil | 62,228 | 67,547 | 69,846 |
| Gross Profit | EUR mil | ... | ... | ... |
| EBITDA | EUR mil | 9,950 | 11,164 | 11,719 |
| EBIT | EUR mil | 6,893 | 8,098 | 8,667 |
| Financing Cost | EUR mil | ... | ... | ... |
| Pre-Tax Profit | EUR mil | 6,429 | 7,556 | 7,934 |
| Net Profit | EUR mil | 4,728 | 5,533 | 6,048 |
| Dividends | EUR mil | ... | ... | ... |
| Balance Sheet | 2023 | 2024 | 2025 | |
| Total Assets | EUR mil | ... | ... | ... |
| Non-Current Assets | EUR mil | ... | ... | ... |
| Current Assets | EUR mil | ... | ... | ... |
| Working Capital | EUR mil | ... | ... | ... |
| Shareholders' Equity | EUR mil | 12,861 | ... | ... |
| Liabilities | EUR mil | ... | ... | ... |
| Total Debt | EUR mil | ... | ... | ... |
| Net Debt | EUR mil | -5,898 | -8,309 | -9,637 |
| Ratios | 2023 | 2024 | 2025 | |
| ROE | % | 42.2 | ... | ... |
| ROCE | % | ... | ... | ... |
| Gross Margin | % | ... | ... | ... |
| EBITDA Margin | % | 16.0 | 16.5 | 16.8 |
| EBIT Margin | % | 11.1 | 12.0 | 12.4 |
| Net Margin | % | 7.60 | 8.19 | 8.66 |
| Net Debt/EBITDA | -0.593 | -0.744 | -0.822 | |
| Net Debt/Equity | % | -45.9 | ... | ... |
| Cost of Financing | % | ... | ... | ... |
| Valuation | 2023 | 2024 | 2025 | |
| Market Capitalisation | USD mil | 59,775 | ... | ... |
| Enterprise Value (EV) | USD mil | 53,160 | ... | ... |
| Number Of Shares | mil | 777 | ... | ... |
| Share Price | EUR | 68.6 | ... | ... |
| EV/EBITDA | 4.71 | ... | ... | |
| EV/Sales | 0.754 | ... | ... | |
| Price/Earnings (P/E) | 11.3 | ... | ... | |
| Price/Book Value (P/BV) | 4.14 | ... | ... | |
| Dividend Yield | % | ... | ... | ... |
Get all company financials in excel:
| overview | Unit | 1998 | 1999 | 2000 | 2001 | 2002 | 2003 | 2004 | 2005 | 2006 | 2007 | 2008 | 2009 | 2010 | 2011 | 2012 | 2013 | 2014 | 2015 | 2016 | 2017 | 2018 | 2019 | 2020 | 2021 | 2022 | 2023 | 2024 | 2025 |
| income statement | |||||||||||||||||||||||||||||
| Sales | EUR mil | 59,022 | 63,707 | 70,478 | 46,216 | 52,315 | |||||||||||||||||||||||
| Gross Profit | EUR mil | 6,873 | 8,787 | 10,505 | ... | ... | ... | ... | ... | ... | |||||||||||||||||||
| EBIT | EUR mil | 2,354 | 4,718 | 1,040 | 1,001 | 3,669 | |||||||||||||||||||||||
| Net Profit | EUR mil | 2,361 | 3,054 | -1,362 | -773 | 2,342 | |||||||||||||||||||||||
| ROE | % | 38.4 | 29.9 | -17.3 | -13.5 | 37.4 | ... | ... | |||||||||||||||||||||
| EBIT Margin | % | 3.99 | 7.41 | 1.48 | 2.17 | 7.01 | |||||||||||||||||||||||
| Net Margin | % | 4.00 | 4.79 | -1.93 | -1.67 | 4.48 | |||||||||||||||||||||||
| Employees | ... | 129,442 | 133,671 | 134,931 | ... | ... | ... | ... | ... | ... | |||||||||||||||||||
| balance sheet | |||||||||||||||||||||||||||||
| Total Assets | EUR mil | 109,449 | 115,198 | 114,409 | ... | ... | ... | ... | ... | ... | |||||||||||||||||||
| Non-Current Assets | EUR mil | 53,525 | 56,564 | 57,686 | ... | ... | ... | ... | ... | ... | |||||||||||||||||||
| Current Assets | EUR mil | 55,924 | 58,634 | 56,723 | ... | ... | ... | ... | ... | ... | |||||||||||||||||||
| Shareholders' Equity | EUR mil | 10,742 | 9,719 | 5,990 | 5,449 | 7,088 | ... | ... | |||||||||||||||||||||
| Liabilities | EUR mil | 98,707 | 105,479 | 108,419 | ... | ... | ... | ... | ... | ... | |||||||||||||||||||
| Non-Current Liabilities | EUR mil | 42,822 | 44,693 | 46,045 | ... | ... | ... | ... | ... | ... | |||||||||||||||||||
| Current Liabilities | EUR mil | 55,885 | 60,786 | 62,374 | ... | ... | ... | ... | ... | ... | |||||||||||||||||||
| Net Debt/EBITDA | ... | ... | -3.30 | -2.10 | -3.99 | -0.214 | -0.248 | ||||||||||||||||||||||
| Net Debt/Equity | % | -131 | -144 | -227 | -14.4 | -22.4 | ... | ... | |||||||||||||||||||||
| Cost of Financing | % | ... | ... | ... | 2.49 | 3.89 | 3.10 | ... | ... | ... | ... | ... | ... | ||||||||||||||||
| cash flow | |||||||||||||||||||||||||||||
| Total Cash From Operations | EUR mil | 4,662 | 2,509 | 3,963 | ... | ... | ... | ... | ... | ... | |||||||||||||||||||
| Total Cash From Investing | EUR mil | -2,748 | -1,826 | -3,074 | ... | ... | ... | ... | ... | ... | |||||||||||||||||||
| Total Cash From Financing | EUR mil | 321 | -3,222 | -958 | ... | ... | ... | ... | ... | ... | |||||||||||||||||||
| Net Change In Cash | EUR mil | 1,861 | -2,593 | -114 | ... | ... | ... | ... | ... | ... | |||||||||||||||||||
| valuation | |||||||||||||||||||||||||||||
| Market Capitalisation | USD mil | ... | ... | 77,274 | 74,587 | 114,621 | 59,775 | 59,775 | ... | ... | |||||||||||||||||||
| Enterprise Value (EV) | USD mil | ... | ... | 60,453 | 58,541 | 99,404 | 58,895 | 57,991 | ... | ... | |||||||||||||||||||
| Number Of Shares | mil | ... | 779 | 775 | 777 | 777 | 777 | ... | ... | ||||||||||||||||||||
| Share Price | EUR | ... | ... | 80.5 | 82.8 | 130 | 68.6 | 68.6 | ... | ... | |||||||||||||||||||
| Price/Earnings (P/E) | ... | ... | 26.5 | 21.1 | -74.6 | -68.9 | 22.8 | ... | ... | ||||||||||||||||||||
| Price/Cash Earnings (P/CE) | ... | ... | 14.7 | 12.8 | 101 | 28.2 | 10.5 | ... | ... | ||||||||||||||||||||
| EV/EBITDA | ... | ... | 12.7 | 7.50 | 25.8 | 14.2 | 7.97 | ... | ... | ||||||||||||||||||||
| Price/Book Value (P/BV) | ... | ... | 5.84 | 6.60 | 16.9 | 9.78 | 7.52 | ... | ... | ||||||||||||||||||||
| Dividend Yield | % | ... | ... | 1.68 | 1.99 | 1.26 | ... | ... | ... | ... | ... | ... |
| income statement | Unit | 1998 | 1999 | 2000 | 2001 | 2002 | 2003 | 2004 | 2005 | 2006 | 2007 | 2008 | 2009 | 2010 | 2011 | 2012 | 2013 | 2014 | 2015 | 2016 | 2017 | 2018 | 2019 | 2020 | 2021 | 2022 | 2023 | 2024 | 2025 |
| income statement | |||||||||||||||||||||||||||||
| Sales | EUR mil | 59,022 | 63,707 | 70,478 | 46,216 | 52,315 | |||||||||||||||||||||||
| Cost of Goods & Services | EUR mil | 52,149 | 54,920 | 59,973 | ... | ... | ... | ... | ... | ... | |||||||||||||||||||
| Gross Profit | EUR mil | 6,873 | 8,787 | 10,505 | ... | ... | ... | ... | ... | ... | |||||||||||||||||||
| Selling, General & Admin | EUR mil | ... | ... | ... | ... | ... | ... | 2,439 | 2,435 | 6,125 | ... | ... | ... | ... | ... | ... | |||||||||||||
| Research & Development | EUR mil | ... | 2,807 | 3,217 | 3,358 | ... | ... | ... | ... | ... | ... | ||||||||||||||||||
| Other Operating Expense | EUR mil | ... | ... | ... | ... | ... | ... | ... | ... | ... | ... | 336 | 182 | 356 | ... | ... | ... | ... | ... | ... | |||||||||
| Staff Cost | EUR mil | 13,140 | 13,147 | 13,973 | ... | ... | ... | ... | ... | ... | |||||||||||||||||||
| Other Operating Cost (Income) | EUR mil | ... | ... | ... | ... | ... | ... | 1,063 | 1,765 | 374 | ... | ... | ... | ... | ... | ... | |||||||||||||
| EBITDA | EUR mil | ... | ... | 4,248 | 6,660 | 3,404 | 3,663 | 6,418 | |||||||||||||||||||||
| Depreciation | EUR mil | ... | ... | 1,894 | 1,942 | 2,364 | 2,662 | 2,749 | |||||||||||||||||||||
| EBIT | EUR mil | 2,354 | 4,718 | 1,040 | 1,001 | 3,669 | |||||||||||||||||||||||
| Net Financing Cost | EUR mil | ... | ... | ... | ... | ... | ... | ... | 328 | 232 | 111 | ... | ... | ... | ... | ... | ... | ||||||||||||
| Financing Cost | EUR mil | ... | ... | ... | 517 | 440 | 339 | ... | ... | ... | ... | ... | ... | ||||||||||||||||
| Financing Income | EUR mil | ... | ... | ... | ... | ... | ... | 189 | 208 | 228 | ... | ... | ... | ... | ... | ... | |||||||||||||
| FX (Gain) Loss | EUR mil | ... | ... | ... | ... | ... | ... | ... | -219 | 238 | 69.0 | ... | ... | ... | ... | ... | ... | ||||||||||||
| (Income) / Loss from Affiliates | EUR mil | ... | ... | ... | -311 | -330 | -299 | ... | ... | ... | ... | ... | ... | ||||||||||||||||
| Extraordinary Cost | EUR mil | ... | ... | ... | -1,989 | -7.00 | -363 | ... | ... | ... | ... | ... | ... | ||||||||||||||||
| Pre-Tax Profit | EUR mil | 3,826 | 4,285 | 1,064 | 628 | 3,259 | |||||||||||||||||||||||
| Tax | EUR mil | 1,462 | 1,274 | 2,389 | ... | ... | ... | ... | ... | ... | |||||||||||||||||||
| Minorities | EUR mil | 3.00 | -43.0 | 37.0 | ... | ... | ... | ... | ... | ... | |||||||||||||||||||
| Net Profit | EUR mil | 2,361 | 3,054 | -1,362 | -773 | 2,342 | |||||||||||||||||||||||
| Net Profit Avail. to Common | EUR mil | 2,361 | 3,054 | -1,362 | -773 | 2,342 | |||||||||||||||||||||||
| Dividends | EUR mil | 1,162 | 1,280 | 1,408 | ... | ... | ... | ... | ... | ... | |||||||||||||||||||
| growth rates | |||||||||||||||||||||||||||||
| Total Revenue Growth | % | ... | -11.4 | 7.94 | 10.6 | -34.4 | 13.2 | ||||||||||||||||||||||
| Operating Cost Growth | % | ... | -6.14 | 4.51 | 68.6 | ... | ... | ... | ... | ... | ... | ||||||||||||||||||
| Staff Cost Growth | % | ... | 0.091 | 0.053 | 6.28 | ... | ... | ... | ... | ... | ... | ||||||||||||||||||
| EBITDA Growth | % | ... | ... | ... | 11.3 | 56.8 | -48.9 | 7.61 | 75.2 | ||||||||||||||||||||
| EBIT Growth | % | ... | 17.3 | 100 | -78.0 | -3.72 | 266 | ||||||||||||||||||||||
| Pre-Tax Profit Growth | % | ... | 196 | 12.0 | -75.2 | -41.0 | 419 | ||||||||||||||||||||||
| Net Profit Growth | % | ... | 137 | 29.4 | -145 | -43.2 | -403 | ||||||||||||||||||||||
| ratios | |||||||||||||||||||||||||||||
| ROE | % | 38.4 | 29.9 | -17.3 | -13.5 | 37.4 | ... | ... | |||||||||||||||||||||
| ROA | % | 2.17 | 2.72 | -1.19 | ... | ... | ... | ... | ... | ... | |||||||||||||||||||
| ROCE | % | 3.12 | 3.98 | -1.72 | ... | ... | ... | ... | ... | ... | |||||||||||||||||||
| Gross Margin | % | 11.6 | 13.8 | 14.9 | ... | ... | ... | ... | ... | ... | |||||||||||||||||||
| EBITDA Margin | % | ... | ... | 7.20 | 10.5 | 4.83 | 7.93 | 12.3 | |||||||||||||||||||||
| EBIT Margin | % | 3.99 | 7.41 | 1.48 | 2.17 | 7.01 | |||||||||||||||||||||||
| Net Margin | % | 4.00 | 4.79 | -1.93 | -1.67 | 4.48 | |||||||||||||||||||||||
| Payout Ratio | % | 49.2 | 41.9 | -103 | ... | ... | ... | ... | ... | ... | |||||||||||||||||||
| Cost of Financing | % | ... | ... | ... | 2.49 | 3.89 | 3.10 | ... | ... | ... | ... | ... | ... | ||||||||||||||||
| Net Debt/EBITDA | ... | ... | -3.30 | -2.10 | -3.99 | -0.214 | -0.248 |
| balance sheet | Unit | 1998 | 1999 | 2000 | 2001 | 2002 | 2003 | 2004 | 2005 | 2006 | 2007 | 2008 | 2009 | 2010 | 2011 | 2012 | 2013 | 2014 | 2015 | 2016 | 2017 | 2018 | 2019 | 2020 | 2021 | 2022 | 2023 | 2024 | 2025 |
| balance sheet | |||||||||||||||||||||||||||||
| Cash & Cash Equivalents | EUR mil | 15,488 | 13,559 | 14,125 | ... | ... | ... | ... | ... | ... | |||||||||||||||||||
| Receivables | EUR mil | 5,487 | 6,078 | 5,674 | ... | ... | ... | ... | ... | ... | |||||||||||||||||||
| Unbilled Revenues | EUR mil | ... | ... | ... | ... | ... | ... | ... | ... | ... | ... | ... | ... | ... | ... | ... | ... | ... | ... | 496 | 789 | 1,167 | ... | ... | ... | ... | ... | ... | |
| Inventories | EUR mil | 29,737 | 31,891 | 31,550 | ... | ... | ... | ... | ... | ... | |||||||||||||||||||
| Other ST Assets | EUR mil | 4,716 | 6,317 | 4,207 | ... | ... | ... | ... | ... | ... | |||||||||||||||||||
| Current Assets | EUR mil | 55,924 | 58,634 | 56,723 | ... | ... | ... | ... | ... | ... | |||||||||||||||||||
| Property, Plant & Equipment | EUR mil | 16,610 | 16,773 | 17,296 | ... | ... | ... | ... | ... | ... | |||||||||||||||||||
| LT Investments & Receivables | EUR mil | 15,230 | 14,553 | 15,556 | ... | ... | ... | ... | ... | ... | |||||||||||||||||||
| Intangible Assets | EUR mil | 11,629 | 16,726 | 16,591 | ... | ... | ... | ... | ... | ... | |||||||||||||||||||
| Goodwill | EUR mil | 9,141 | 13,039 | 13,019 | ... | ... | ... | ... | ... | ... | |||||||||||||||||||
| Non-Current Assets | EUR mil | 53,525 | 56,564 | 57,686 | ... | ... | ... | ... | ... | ... | |||||||||||||||||||
| Total Assets | EUR mil | 109,449 | 115,198 | 114,409 | ... | ... | ... | ... | ... | ... | |||||||||||||||||||
| Trade Payables | EUR mil | 13,406 | 16,237 | 14,808 | ... | ... | ... | ... | ... | ... | |||||||||||||||||||
| Short-Term Debt | EUR mil | 3,118 | 2,302 | 3,046 | ... | ... | ... | ... | ... | ... | |||||||||||||||||||
| Other ST Liabilities | EUR mil | 36,483 | 38,809 | 41,126 | ... | ... | ... | ... | ... | ... | |||||||||||||||||||
| Current Liabilities | EUR mil | 55,885 | 60,786 | 62,374 | ... | ... | ... | ... | ... | ... | |||||||||||||||||||
| Long-Term Debt | EUR mil | 9,282 | 7,923 | 8,573 | ... | ... | ... | ... | ... | ... | |||||||||||||||||||
| Other LT Liabilities | EUR mil | 33,540 | 36,770 | 37,472 | ... | ... | ... | ... | ... | ... | |||||||||||||||||||
| Non-Current Liabilities | EUR mil | 42,822 | 44,693 | 46,045 | ... | ... | ... | ... | ... | ... | |||||||||||||||||||
| Liabilities | EUR mil | 98,707 | 105,479 | 108,419 | ... | ... | ... | ... | ... | ... | |||||||||||||||||||
| Preferred Equity and Hybrid Capital | EUR mil | ... | 0 | 0 | 0 | ... | ... | ... | ... | ... | ... | ||||||||||||||||||
| Share Capital | EUR mil | 3,601 | 3,718 | 4,339 | ... | ... | ... | ... | ... | ... | |||||||||||||||||||
| Treasury Stock | EUR mil | ... | ... | 2.00 | 51.0 | 82.0 | ... | ... | ... | ... | ... | ... | |||||||||||||||||
| Equity Before Minority Interest | EUR mil | 10,740 | 9,724 | 5,975 | ... | ... | ... | ... | ... | ... | |||||||||||||||||||
| Minority Interest | EUR mil | 2.00 | -5.00 | 15.0 | ... | ... | ... | ... | ... | ... | |||||||||||||||||||
| Equity | EUR mil | 10,742 | 9,719 | 5,990 | 5,449 | 7,088 | ... | ... | |||||||||||||||||||||
| growth rates | |||||||||||||||||||||||||||||
| Total Asset Growth | % | ... | 1.66 | 5.25 | -0.685 | ... | ... | ... | ... | ... | ... | ||||||||||||||||||
| Shareholders' Equity Growth | % | ... | 590 | -9.52 | -38.4 | -9.04 | 30.1 | ... | ... | ||||||||||||||||||||
| Net Debt Growth | % | ... | -345 | -0.257 | -3.03 | -94.2 | 103 | ||||||||||||||||||||||
| Total Debt Growth | % | ... | -57.4 | -17.5 | 13.6 | ... | ... | ... | ... | ... | ... | ||||||||||||||||||
| ratios | |||||||||||||||||||||||||||||
| Total Debt | EUR mil | 12,400 | 10,225 | 11,619 | ... | ... | ... | ... | ... | ... | |||||||||||||||||||
| Net Debt | EUR mil | -14,032 | -13,996 | -13,572 | -784 | -1,591 | |||||||||||||||||||||||
| Working Capital | EUR mil | 21,818 | 21,732 | 22,416 | ... | ... | ... | ... | ... | ... | |||||||||||||||||||
| Capital Employed | EUR mil | 75,343 | 78,296 | 80,102 | ... | ... | ... | ... | ... | ... | |||||||||||||||||||
| Net Debt/Equity | % | -131 | -144 | -227 | -14.4 | -22.4 | ... | ... | |||||||||||||||||||||
| Current Ratio | 1.00 | 0.965 | 0.909 | ... | ... | ... | ... | ... | ... | ||||||||||||||||||||
| Quick Ratio | 0.375 | 0.323 | 0.317 | ... | ... | ... | ... | ... | ... |
| cash flow | Unit | 1998 | 1999 | 2000 | 2001 | 2002 | 2003 | 2004 | 2005 | 2006 | 2007 | 2008 | 2009 | 2010 | 2011 | 2012 | 2013 | 2014 | 2015 | 2016 | 2017 | 2018 | 2019 | 2020 | 2021 | 2022 | 2023 | 2024 | 2025 |
| cash flow | |||||||||||||||||||||||||||||
| Net Profit | EUR mil | 2,361 | 3,054 | -1,362 | -773 | 2,342 | |||||||||||||||||||||||
| Depreciation | EUR mil | ... | ... | 1,894 | 1,942 | 2,364 | 2,662 | 2,749 | |||||||||||||||||||||
| Non-Cash Items | EUR mil | -358 | -2,356 | 182 | ... | ... | ... | ... | ... | ... | |||||||||||||||||||
| Change in Working Capital | EUR mil | 361 | -633 | 2,216 | ... | ... | ... | ... | ... | ... | |||||||||||||||||||
| Total Cash From Operations | EUR mil | 4,662 | 2,509 | 3,963 | ... | ... | ... | ... | ... | ... | |||||||||||||||||||
| Capital Expenditures | EUR mil | ... | ... | ... | ... | ... | ... | ... | ... | ... | ... | -2,381 | -2,072 | -2,228 | ... | ... | ... | ... | ... | ... | |||||||||
| Net Change in LT Investment | EUR mil | ... | ... | ... | ... | -1,614 | -203 | -991 | ... | ... | ... | ... | ... | ... | |||||||||||||||
| Net Cash From Acquisitions | EUR mil | ... | ... | ... | ... | ... | ... | ... | ... | ... | ... | 354 | 129 | 8.00 | ... | ... | ... | ... | ... | ... | |||||||||
| Other Investing Activities | EUR mil | ... | 893 | 320 | 137 | ... | ... | ... | ... | ... | ... | ||||||||||||||||||
| Total Cash From Investing | EUR mil | -2,748 | -1,826 | -3,074 | ... | ... | ... | ... | ... | ... | |||||||||||||||||||
| Dividends Paid | EUR mil | ... | -1,043 | -1,161 | -1,280 | ... | ... | ... | ... | ... | ... | ||||||||||||||||||
| Issuance Of Shares | EUR mil | 83.0 | 68.0 | 163 | ... | ... | ... | ... | ... | ... | |||||||||||||||||||
| Issuance Of Debt | EUR mil | ... | 1,284 | -2,129 | 159 | ... | ... | ... | ... | ... | ... | ||||||||||||||||||
| Other Financing Activities | EUR mil | -3.00 | 0 | 0 | ... | ... | ... | ... | ... | ... | |||||||||||||||||||
| Total Cash From Financing | EUR mil | 321 | -3,222 | -958 | ... | ... | ... | ... | ... | ... | |||||||||||||||||||
| Effect of FX Rates | EUR mil | ... | ... | ... | ... | ... | ... | ... | ... | ... | ... | -374 | -54.0 | -45.0 | ... | ... | ... | ... | ... | ... | |||||||||
| Net Change In Cash | EUR mil | 1,861 | -2,593 | -114 | ... | ... | ... | ... | ... | ... | |||||||||||||||||||
| ratios | |||||||||||||||||||||||||||||
| Days Sales Outstanding | days | 33.9 | 34.8 | 29.4 | ... | ... | ... | ... | ... | ... | |||||||||||||||||||
| Days Sales Of Inventory | days | 208 | 212 | 192 | ... | ... | ... | ... | ... | ... | |||||||||||||||||||
| Days Payable Outstanding | days | 93.8 | 108 | 90.1 | ... | ... | ... | ... | ... | ... | |||||||||||||||||||
| Cash Conversion Cycle | days | 148 | 139 | 131 | ... | ... | ... | ... | ... | ... | |||||||||||||||||||
| Cash Earnings | EUR mil | ... | ... | 4,255 | 4,996 | 1,002 | 1,888 | 5,091 | |||||||||||||||||||||
| Free Cash Flow | EUR mil | 1,914 | 683 | 889 | ... | ... | ... | ... | ... | ... | |||||||||||||||||||
| Capital Expenditures (As % of Sales) | % | 4.03 | 3.25 | 3.16 | ... | ... | ... | ... | ... | ... |
| other ratios | Unit | 1998 | 1999 | 2000 | 2001 | 2002 | 2003 | 2004 | 2005 | 2006 | 2007 | 2008 | 2009 | 2010 | 2011 | 2012 | 2013 | 2014 | 2015 | 2016 | 2017 | 2018 | 2019 | 2020 | 2021 | 2022 | 2023 | 2024 | 2025 |
| Employees | ... | 129,442 | 133,671 | 134,931 | ... | ... | ... | ... | ... | ... | |||||||||||||||||||
| Cost Per Employee | USD per month | ... | 9,499 | 9,600 | 9,779 | ... | ... | ... | ... | ... | ... | ||||||||||||||||||
| Cost Per Employee (Local Currency) | EUR per month | ... | 8,459 | 8,196 | 8,630 | ... | ... | ... | ... | ... | ... | ||||||||||||||||||
| Employee Turnover | % | ... | ... | ... | ... | ... | ... | ... | ... | ... | 3.91 | 4.90 | 4.40 | ... | ... | ... | ... | ... | ... | ||||||||||
| Women (As % of Workforce) | % | ... | ... | ... | ... | ... | ... | ... | ... | 17.5 | 17.7 | 18.0 | ... | ... | ... | ... | ... | ... | |||||||||||
| Women (As % of Management) | % | ... | ... | ... | ... | ... | ... | ... | ... | ... | ... | ... | ... | ... | ... | ... | ... | ... | ... | ... | ... | ... | ... | ||||||
| Operating Cost (As % of Sales) | % | 9.46 | 9.16 | 14.0 | ... | ... | ... | ... | ... | ... | |||||||||||||||||||
| Research & Development (As % of Sales) | % | ... | 4.76 | 5.05 | 4.76 | ... | ... | ... | ... | ... | ... | ||||||||||||||||||
| Staff Cost (As % of Sales) | % | 22.3 | 20.6 | 19.8 | ... | ... | ... | ... | ... | ... | |||||||||||||||||||
| Effective Tax Rate | % | 38.2 | 29.7 | 225 | ... | ... | ... | ... | ... | ... | |||||||||||||||||||
| Total Revenue Growth (5-year average) | % | ... | ... | ... | ... | ... | 0.884 | 2.05 | 3.03 | -6.43 | -4.71 | ||||||||||||||||||
| Total Revenue Growth (10-year average) | % | ... | ... | ... | ... | ... | ... | ... | ... | ... | ... | 4.20 | 3.95 | 5.11 | 0.101 | 0.631 |
| valuation | Unit | 1998 | 1999 | 2000 | 2001 | 2002 | 2003 | 2004 | 2005 | 2006 | 2007 | 2008 | 2009 | 2010 | 2011 | 2012 | 2013 | 2014 | 2015 | 2016 | 2017 | 2018 | 2019 | 2020 | 2021 | 2022 | 2023 | 2024 | 2025 |
| Market Capitalisation | USD mil | ... | ... | 77,274 | 74,587 | 114,621 | 59,775 | 59,775 | ... | ... | |||||||||||||||||||
| Enterprise Value (EV) | USD mil | ... | ... | 60,453 | 58,541 | 99,404 | 58,895 | 57,991 | ... | ... | |||||||||||||||||||
| Number Of Shares | mil | ... | 779 | 775 | 777 | 777 | 777 | ... | ... | ||||||||||||||||||||
| Share Price | EUR | ... | ... | 80.5 | 82.8 | 130 | 68.6 | 68.6 | ... | ... | |||||||||||||||||||
| EV/EBITDA | ... | ... | 12.7 | 7.50 | 25.8 | 14.2 | 7.97 | ... | ... | ||||||||||||||||||||
| Price/Earnings (P/E) | ... | ... | 26.5 | 21.1 | -74.6 | -68.9 | 22.8 | ... | ... | ||||||||||||||||||||
| Price/Cash Earnings (P/CE) | ... | ... | 14.7 | 12.8 | 101 | 28.2 | 10.5 | ... | ... | ||||||||||||||||||||
| P/FCF | ... | ... | 32.8 | 94.0 | 114 | ... | ... | ... | ... | ... | ... | ||||||||||||||||||
| Price/Book Value (P/BV) | ... | ... | 5.84 | 6.60 | 16.9 | 9.78 | 7.52 | ... | ... | ||||||||||||||||||||
| Dividend Yield | % | ... | ... | 1.68 | 1.99 | 1.26 | ... | ... | ... | ... | ... | ... | |||||||||||||||||
| Free Cash Flow Yield | % | ... | ... | 2.78 | 1.07 | 0.879 | ... | ... | ... | ... | ... | ... | |||||||||||||||||
| Earnings Per Share (EPS) | EUR | ... | 3.04 | 3.92 | -1.75 | -0.995 | 3.01 | ... | ... | ||||||||||||||||||||
| Cash Earnings Per Share | EUR | ... | ... | 5.46 | 6.45 | 1.29 | 2.43 | 6.55 | ... | ... | |||||||||||||||||||
| Free Cash Flow Per Share | EUR | ... | 2.46 | 0.881 | 1.14 | ... | ... | ... | ... | ... | ... | ||||||||||||||||||
| Book Value Per Share | EUR | ... | 13.8 | 12.5 | 7.71 | 7.01 | 9.12 | ... | ... | ||||||||||||||||||||
| Dividend Per Share | EUR | ... | 1.35 | 1.65 | 1.65 | ... | ... | ... | ... | ... | ... | ||||||||||||||||||
| EV/Sales | ... | ... | 0.912 | 0.785 | 1.24 | 1.12 | 0.978 | ... | ... | ||||||||||||||||||||
| EV/EBIT | ... | ... | 22.9 | 10.6 | 84.3 | 51.9 | 13.9 | ... | ... | ||||||||||||||||||||
| EV/Free Cash Flow | ... | ... | 28.1 | 73.2 | 98.7 | ... | ... | ... | ... | ... | ... | ||||||||||||||||||
| EV/Capital Employed | ... | ... | 0.669 | 0.652 | 1.11 | ... | ... | ... | ... | ... | ... | ||||||||||||||||||
| Earnings Per Share Growth | % | ... | ... | ... | 136 | 28.9 | -145 | -43.1 | -403 | ... | ... | ||||||||||||||||||
| Cash Earnings Per Share Growth | % | ... | ... | ... | 51.6 | 18.0 | -80.0 | 88.5 | 170 | ... | ... | ||||||||||||||||||
| Book Value Per Share Growth | % | ... | ... | ... | 590 | -9.04 | -38.5 | -9.04 | 30.1 | ... | ... |
Get all company financials in excel:


By Helgi Library - November 4, 2020
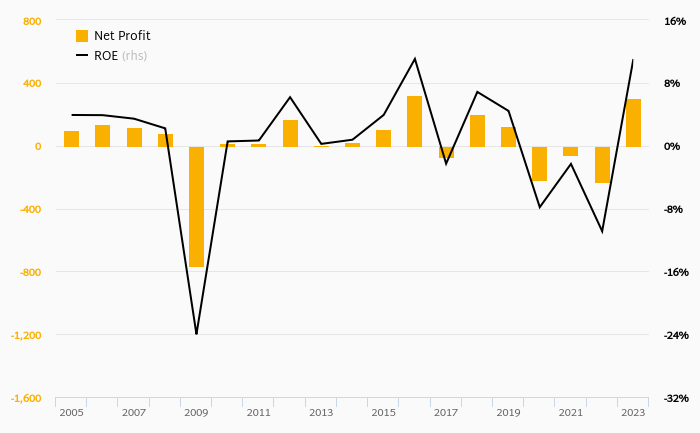
Airbus made a net profit of EUR -767 mil in 3Q2020, down 178% compared to the previous year. Historically, between 3Q1998 and 3Q2020, the company's net profit reached a high of EUR 1,601 mil in 4Q2018 and a low of EUR -3,548 mil in 4Q2019. The result impl...
By Helgi Library - November 4, 2020
Airbus invested a total of EUR 273 mil in 3Q2020, down 48% compared to the previous year. Historically, between 1Q2005 - 3Q2020, the company's investments stood at a high of EUR 1,358 mil in 4Q2012 and a low of EUR 237 mil in 1Q2018. ...
By Helgi Library - November 4, 2020
Airbus generated sales of EUR 11,213 mil in 3Q2020, down 26.7% compared to the previous year. Historically, between 3Q1998 and 3Q2020, the company’s sales reached a high of EUR 24,310 mil in 4Q2019 and a low of EUR 2,101 mil in 4Q1998. Over the la...
By Helgi Library - November 4, 2020
Airbus made a net profit of EUR -767 mil with revenues of EUR 11,213 mil in 3Q2020, down by 178% and down by 26.7%, respectively, compared to the previous year. This translates into a net margin of -6.84%. Historically, between 1998-12-31 and 3Q2020, ...
By Helgi Library - November 4, 2020
Airbus stock traded at EUR 68.6 per share at the end 3Q2020 implying a market capitalization of USD 57,016 mil. Since the end of 3Q2015, stock has appreciated by 39.5% implying an annual average growth of 6.89% In absolute terms, the value of the company ...
By Helgi Library - November 4, 2020
Airbus's operating cash flow stood at EUR 841 mil in 3Q2020, up 309% when compared to the previous year. Historically, between 3Q1998 - 3Q2020, the firm’s operating cash flow reached a high of EUR 7,774 mil in 4Q2019 and a low of EUR -7,614 mil in ...
By Helgi Library - November 4, 2020
Airbus's net debt stood at EUR 4,586 mil and accounted for 813% of equity at the end of 3Q2020. The ratio is up 786 pp compared to the previous year. Historically, the firm’s net debt to equity reached a high of 813% in 3Q2020 and a low of -3...
By Helgi Library - November 4, 2020
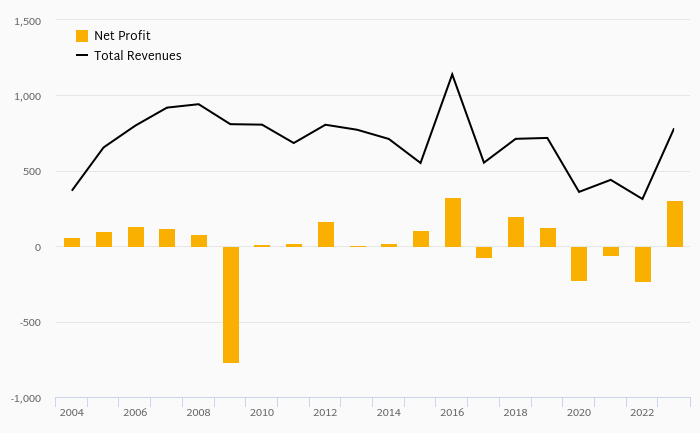
Airbus made a net profit of EUR -1,362 mil with revenues of EUR 70,478 mil in 2019, down by 145% and up by 10.6%, respectively, compared to the previous year. This translates into a net margin of -1.93%. On the operating level, EBITDA reached EUR 3,404 mi...
By Helgi Library - November 4, 2020
Airbus stock traded at EUR 130 per share at the end 2019 translating into a market capitalization of USD 114,621 mil. Since the end of 2014, stock has appreciated by 246% representing an annual average growth of 28.2%. In absolute terms, the value of th...
By Helgi Library - November 4, 2020
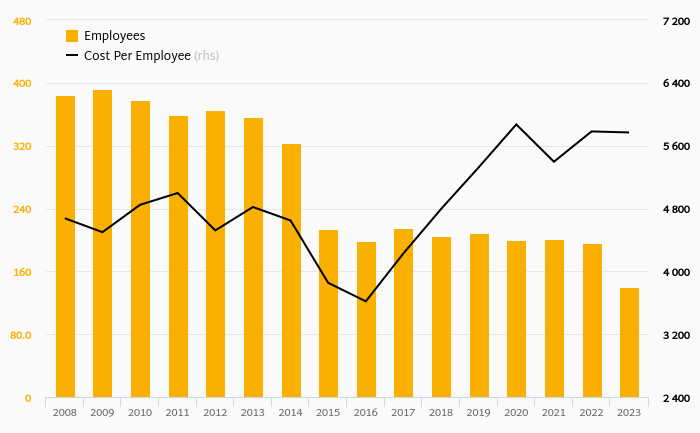
Airbus employed 134,931 employees in 2019, up 0.943% compared to the previous year. Historically, between 1999 and 2019, the firm's workforce hit a high of 144,061 employees in 2013 and a low of 88,879 employees in 2000. Average personnel cost stood ...

Airbus has been growing its sales by 8.61% a year on average in the last 5 years. EBITDA has grown on average by 26.2% a year during that time to total of EUR 11,719 mil in 2025, or 16.8% of sales. That’s compared to 15.2% average margin seen in last five years.
The company netted EUR 6,048 mil in 2025 implying ROE of and ROCE of . Again, the average figures were 40.6% and %, respectively when looking at the previous 5 years.
Airbus’s net debt amounted to EUR -9,637 mil at the end of 2025, or of equity. When compared to EBITDA, net debt was -0.822x, down when compared to average of -0.577x seen in the last 5 years.
Airbus stock traded at per share at the end of 2025 resulting in a market capitalization of . Over the previous five years, stock price grew by 0% or % a year on average. The closing price put stock at a 12-month trailing EV/EBITDA of x and price to earnings (PE) of x as of 2025.
 Helgi Library