By Helgi Library - April 2, 2020
CCC's total assets reached PLN 2,072 mil at the end of 2015, up 15.5% compared to the previous year. Current asset...
| Profit Statement | 2013 | 2014 | 2015 | |
| Sales | PLN mil | 1,643 | 2,010 | 2,307 |
| Gross Profit | PLN mil | 837 | 1,107 | 1,262 |
| EBITDA | PLN mil | 203 | 296 | 324 |
| EBIT | PLN mil | 168 | 243 | 257 |
| Financing Cost | PLN mil | 14.8 | 16.5 | 21.0 |
| Pre-Tax Profit | PLN mil | 151 | 225 | 233 |
| Net Profit | PLN mil | 125 | 420 | 259 |
| Dividends | PLN mil | 61.4 | 115 | ... |
| Balance Sheet | 2013 | 2014 | 2015 | |
| Total Assets | PLN mil | 1,120 | 1,794 | 2,072 |
| Non-Current Assets | PLN mil | 430 | 813 | 920 |
| Current Assets | PLN mil | 690 | 982 | 1,152 |
| Working Capital | PLN mil | 322 | 589 | 654 |
| Shareholders' Equity | PLN mil | 592 | 952 | 1,124 |
| Liabilities | PLN mil | 528 | 842 | 948 |
| Total Debt | PLN mil | 328 | 578 | 719 |
| Net Debt | PLN mil | 184 | 416 | 360 |
| Ratios | 2013 | 2014 | 2015 | |
| ROE | % | 22.3 | 54.4 | 25.0 |
| ROCE | % | 16.9 | 39.0 | 17.4 |
| Gross Margin | % | 50.9 | 55.1 | 54.7 |
| EBITDA Margin | % | 12.4 | 14.7 | 14.0 |
| EBIT Margin | % | 10.2 | 12.1 | 11.1 |
| Net Margin | % | 7.62 | 20.9 | 11.2 |
| Net Debt/EBITDA | 0.905 | 1.41 | 1.11 | |
| Net Debt/Equity | 0.311 | 0.437 | 0.321 | |
| Cost of Financing | % | 4.81 | 3.64 | 3.24 |
| Valuation | 2013 | 2014 | 2015 | |
| Market Capitalisation | USD mil | 1,486 | 1,448 | 1,364 |
| Enterprise Value (EV) | USD mil | 1,547 | 1,566 | 1,456 |
| Number Of Shares | mil | 38.4 | 38.4 | 38.4 |
| Share Price | PLN | 117 | 134 | 139 |
| EV/EBITDA | 24.0 | 17.3 | 16.7 | |
| EV/Sales | 2.98 | 2.55 | 2.35 | |
| Price/Earnings (P/E) | 35.8 | 12.2 | 20.5 | |
| Price/Book Value (P/BV) | 7.57 | 5.38 | 4.74 | |
| Dividend Yield | % | 1.37 | 2.25 | ... |
Get all company financials in excel:
| summary | Unit | 2001 | 2002 | 2003 | 2004 | 2005 | 2006 | 2007 | 2008 | 2009 | 2010 | 2011 | 2012 | 2013 | 2014 | 2015 |
| income statement | ||||||||||||||||
| Sales | PLN mil | 922 | 1,029 | 1,091 | 1,317 | 1,643 | ||||||||||
| Gross Profit | PLN mil | 610 | 694 | 793 | 880 | 837 | ||||||||||
| EBIT | PLN mil | 108 | 132 | 164 | 148 | 168 | ||||||||||
| Net Profit | PLN mil | 83.6 | 118 | 123 | 106 | 125 | ||||||||||
| ROE | % | 26.3 | 30.9 | 26.8 | 20.8 | 22.3 | ||||||||||
| EBIT Margin | % | 11.7 | 12.8 | 15.0 | 11.2 | 10.2 | ||||||||||
| Net Margin | % | 9.06 | 11.5 | 11.3 | 8.07 | 7.62 | ||||||||||
| Employees | ... | ... | ... | ... | 4,667 | 4,906 | 6,376 | 6,474 | 7,861 | |||||||
| balance sheet | ||||||||||||||||
| Total Assets | PLN mil | 551 | 678 | 966 | 978 | 1,120 | ||||||||||
| Non-Current Assets | PLN mil | 210 | 270 | 367 | 387 | 430 | ||||||||||
| Current Assets | PLN mil | 341 | 408 | 598 | 591 | 690 | ||||||||||
| Shareholders' Equity | PLN mil | 340 | 423 | 495 | 529 | 592 | ||||||||||
| Liabilities | PLN mil | 211 | 255 | 471 | 449 | 528 | ||||||||||
| Non-Current Liabilities | PLN mil | 81.4 | 105 | 209 | 124 | 193 | ||||||||||
| Current Liabilities | PLN mil | 130 | 150 | 262 | 325 | 335 | ||||||||||
| Net Debt/EBITDA | 0.470 | 0.432 | 1.30 | 0.873 | 0.905 | |||||||||||
| Net Debt/Equity | 0.175 | 0.157 | 0.493 | 0.308 | 0.311 | |||||||||||
| Cost of Financing | % | ... | 6.47 | 3.84 | 3.37 | 4.94 | 4.81 | |||||||||
| cash flow | ||||||||||||||||
| Total Cash From Operations | PLN mil | 119 | 83.7 | -23.2 | 194 | 145 | ||||||||||
| Total Cash From Investing | PLN mil | -46.3 | -52.3 | -96.8 | -51.1 | -92.6 | ||||||||||
| Total Cash From Financing | PLN mil | -27.0 | -9.22 | 71.8 | -65.5 | -34.7 | ||||||||||
| Net Change In Cash | PLN mil | 45.5 | 22.2 | -48.1 | 77.9 | 18.0 | ||||||||||
| valuation | ||||||||||||||||
| Market Capitalisation | USD mil | ... | ... | ... | 652 | 882 | 524 | 906 | 1,486 | |||||||
| Number Of Shares | mil | 38.4 | 38.4 | 38.4 | 38.4 | 38.4 | ||||||||||
| Share Price | PLN | ... | ... | ... | 48.6 | 68.0 | 47.0 | 73.0 | 117 | |||||||
| Earnings Per Share (EPS) | PLN | 2.18 | 3.07 | 3.20 | 2.77 | 3.26 | ||||||||||
| Book Value Per Share | PLN | 8.86 | 11.0 | 12.9 | 13.8 | 15.4 | ||||||||||
| Dividend Per Share | PLN | ... | ... | ... | 1.00 | 1.50 | 1.59 | 1.60 | 1.60 | ... | ||||||
| Price/Earnings (P/E) | ... | ... | ... | 22.3 | 22.2 | 14.7 | 26.4 | 35.8 | ||||||||
| Price/Book Value (P/BV) | ... | ... | ... | 5.49 | 6.18 | 3.65 | 5.30 | 7.57 | ||||||||
| Dividend Yield | % | ... | ... | ... | 2.06 | 2.21 | 3.39 | 2.19 | 1.37 | ... | ||||||
| Earnings Per Share Growth | % | ... | -18.4 | 41.0 | 4.17 | -13.4 | 17.8 | |||||||||
| Book Value Per Share Growth | % | ... | 15.3 | 24.3 | 17.1 | 6.79 | 11.9 |
| income statement | Unit | 2001 | 2002 | 2003 | 2004 | 2005 | 2006 | 2007 | 2008 | 2009 | 2010 | 2011 | 2012 | 2013 | 2014 | 2015 |
| income statement | ||||||||||||||||
| Sales | PLN mil | 922 | 1,029 | 1,091 | 1,317 | 1,643 | ||||||||||
| Cost of Goods & Services | PLN mil | 313 | 334 | 299 | 437 | 806 | ||||||||||
| Gross Profit | PLN mil | 610 | 694 | 793 | 880 | 837 | ||||||||||
| Staff Cost | PLN mil | ... | ... | ... | ... | 128 | 138 | 180 | 202 | 260 | ||||||
| Other Cost | PLN mil | ... | ... | ... | ... | 355 | 403 | 424 | 492 | 373 | ||||||
| EBITDA | PLN mil | 127 | 154 | 188 | 187 | 203 | ||||||||||
| Depreciation | PLN mil | 18.3 | 22.2 | 24.2 | 39.0 | 35.9 | ||||||||||
| EBIT | PLN mil | 108 | 132 | 164 | 148 | 168 | ||||||||||
| Financing Cost | PLN mil | 7.41 | 5.18 | 7.23 | 14.0 | 14.8 | ||||||||||
| Extraordinary Cost | PLN mil | 1.08 | 3.90 | 5.48 | 7.33 | 1.40 | ||||||||||
| Pre-Tax Profit | PLN mil | 99.7 | 123 | 151 | 126 | 151 | ||||||||||
| Tax | PLN mil | 16.1 | 4.75 | 28.6 | 20.0 | 26.1 | ||||||||||
| Minorities | PLN mil | 0 | 0 | 0 | 0 | 0 | ||||||||||
| Net Profit | PLN mil | 83.6 | 118 | 123 | 106 | 125 | ||||||||||
| Dividends | PLN mil | ... | ... | ... | 38.4 | 57.6 | 61.2 | 61.4 | 61.4 | ... | ||||||
| growth rates | ||||||||||||||||
| Total Revenue Growth | % | ... | 22.3 | 11.5 | 6.10 | 20.7 | 24.7 | |||||||||
| Operating Cost Growth | % | ... | ... | ... | ... | ... | 27.0 | 11.9 | 11.8 | 14.8 | -8.69 | |||||
| EBITDA Growth | % | ... | -12.7 | 21.6 | 22.4 | -0.880 | 8.98 | |||||||||
| EBIT Growth | % | ... | -18.0 | 21.8 | 24.6 | -9.99 | 13.4 | |||||||||
| Pre-Tax Profit Growth | % | ... | -18.4 | 23.0 | 23.5 | -16.5 | 19.8 | |||||||||
| Net Profit Growth | % | ... | -18.4 | 41.0 | 4.17 | -13.4 | 17.8 | |||||||||
| ratios | ||||||||||||||||
| ROE | % | 26.3 | 30.9 | 26.8 | 20.8 | 22.3 | ||||||||||
| ROCE | % | ... | 19.9 | 26.0 | 19.5 | 14.0 | 16.9 | |||||||||
| Gross Margin | % | 66.1 | 67.5 | 72.6 | 66.8 | 50.9 | ||||||||||
| EBITDA Margin | % | 13.7 | 15.0 | 17.3 | 14.2 | 12.4 | ||||||||||
| EBIT Margin | % | 11.7 | 12.8 | 15.0 | 11.2 | 10.2 | ||||||||||
| Net Margin | % | 9.06 | 11.5 | 11.3 | 8.07 | 7.62 | ||||||||||
| Payout Ratio | % | ... | ... | ... | 45.9 | 48.9 | 49.9 | 57.8 | 49.1 | ... | ||||||
| Cost of Financing | % | ... | 6.47 | 3.84 | 3.37 | 4.94 | 4.81 | |||||||||
| Net Debt/EBITDA | 0.470 | 0.432 | 1.30 | 0.873 | 0.905 |
| balance sheet | Unit | 2001 | 2002 | 2003 | 2004 | 2005 | 2006 | 2007 | 2008 | 2009 | 2010 | 2011 | 2012 | 2013 | 2014 | 2015 |
| balance sheet | ||||||||||||||||
| Non-Current Assets | PLN mil | 210 | 270 | 367 | 387 | 430 | ||||||||||
| Property, Plant & Equipment | PLN mil | 203 | 241 | 332 | 355 | 397 | ||||||||||
| Intangible Assets | PLN mil | 1.07 | 0.882 | 6.75 | 7.78 | 9.17 | ||||||||||
| Current Assets | PLN mil | 341 | 408 | 598 | 591 | 690 | ||||||||||
| Inventories | PLN mil | 243 | 252 | 485 | 399 | 463 | ||||||||||
| Receivables | PLN mil | 25.3 | 42.1 | 39.9 | 59.7 | 14.8 | ||||||||||
| Cash & Cash Equivalents | PLN mil | 60.9 | 83.1 | 34.9 | 126 | 144 | ||||||||||
| Total Assets | PLN mil | 551 | 678 | 966 | 978 | 1,120 | ||||||||||
| Shareholders' Equity | PLN mil | 340 | 423 | 495 | 529 | 592 | ||||||||||
| Of Which Minority Interest | PLN mil | 0 | 0 | 0 | 0 | 0 | ||||||||||
| Liabilities | PLN mil | 211 | 255 | 471 | 449 | 528 | ||||||||||
| Non-Current Liabilities | PLN mil | 81.4 | 105 | 209 | 124 | 193 | ||||||||||
| Long-Term Debt | PLN mil | 80.2 | 103 | 207 | 88.0 | 158 | ||||||||||
| Deferred Tax Liabilities | PLN mil | ... | ... | ... | ... | ... | ... | ... | ... | ... | ... | ... | ... | ... | ||
| Current Liabilities | PLN mil | 130 | 150 | 262 | 325 | 335 | ||||||||||
| Short-Term Debt | PLN mil | 40.1 | 46.1 | 72.0 | 201 | 170 | ||||||||||
| Trade Payables | PLN mil | 48.2 | 86.8 | 108 | 116 | 155 | ||||||||||
| Equity And Liabilities | PLN mil | 551 | 678 | 966 | 978 | 1,120 | ||||||||||
| growth rates | ||||||||||||||||
| Total Asset Growth | % | ... | 12.1 | 23.1 | 42.4 | 1.29 | 14.5 | |||||||||
| Shareholders' Equity Growth | % | ... | 15.3 | 24.3 | 17.1 | 6.79 | 11.9 | |||||||||
| Net Debt Growth | % | ... | -36.3 | 11.8 | 267 | -33.2 | 13.0 | |||||||||
| Total Debt Growth | % | ... | 10.8 | 24.2 | 86.6 | 3.50 | 13.6 | |||||||||
| ratios | ||||||||||||||||
| Total Debt | PLN mil | 120 | 149 | 279 | 289 | 328 | ||||||||||
| Net Debt | PLN mil | 59.4 | 66.4 | 244 | 163 | 184 | ||||||||||
| Working Capital | PLN mil | 220 | 208 | 417 | 343 | 322 | ||||||||||
| Capital Employed | PLN mil | 430 | 478 | 784 | 730 | 753 | ||||||||||
| Net Debt/Equity | 0.175 | 0.157 | 0.493 | 0.308 | 0.311 | |||||||||||
| Cost of Financing | % | ... | 6.47 | 3.84 | 3.37 | 4.94 | 4.81 |
| cash flow | Unit | 2001 | 2002 | 2003 | 2004 | 2005 | 2006 | 2007 | 2008 | 2009 | 2010 | 2011 | 2012 | 2013 | 2014 | 2015 |
| cash flow | ||||||||||||||||
| Net Profit | PLN mil | 83.6 | 118 | 123 | 106 | 125 | ||||||||||
| Depreciation | PLN mil | 18.3 | 22.2 | 24.2 | 39.0 | 35.9 | ||||||||||
| Non-Cash Items | PLN mil | ... | 9.58 | -68.4 | 39.2 | -25.4 | -35.9 | |||||||||
| Change in Working Capital | PLN mil | ... | 7.35 | 12.0 | -209 | 74.6 | 20.2 | |||||||||
| Total Cash From Operations | PLN mil | 119 | 83.7 | -23.2 | 194 | 145 | ||||||||||
| Capital Expenditures | PLN mil | -46.3 | -60.6 | -116 | -54.2 | -99.4 | ||||||||||
| Other Investments | PLN mil | 0.005 | 8.33 | 19.5 | 3.08 | 6.77 | ||||||||||
| Total Cash From Investing | PLN mil | -46.3 | -52.3 | -96.8 | -51.1 | -92.6 | ||||||||||
| Dividends Paid | PLN mil | ... | ... | ... | -38.4 | -57.6 | -61.2 | -61.4 | -61.4 | ... | ||||||
| Issuance Of Debt | PLN mil | ... | 11.7 | 29.2 | 129 | 9.76 | 39.2 | |||||||||
| Total Cash From Financing | PLN mil | -27.0 | -9.22 | 71.8 | -65.5 | -34.7 | ||||||||||
| Net Change In Cash | PLN mil | 45.5 | 22.2 | -48.1 | 77.9 | 18.0 | ||||||||||
| ratios | ||||||||||||||||
| Days Sales Outstanding | days | 9.99 | 14.9 | 13.3 | 16.5 | 3.29 | ||||||||||
| Days Sales Of Inventory | days | 283 | 276 | 592 | 333 | 210 | ||||||||||
| Days Payable Outstanding | days | 56.2 | 94.7 | 131 | 97.1 | 70.3 | ||||||||||
| Cash Conversion Cycle | days | 237 | 196 | 474 | 253 | 143 | ||||||||||
| Cash Earnings | PLN mil | 102 | 140 | 147 | 145 | 161 | ||||||||||
| Cash Earnings Per Share | PLN | 2.65 | 3.65 | 3.83 | 3.78 | 4.20 | ||||||||||
| Price/Cash Earnings (P/CE) | ... | ... | ... | 18.3 | 18.6 | 12.3 | 19.3 | 27.8 | ||||||||
| Free Cash Flow | PLN mil | 72.6 | 31.4 | -120 | 143 | 52.7 | ||||||||||
| Free Cash Flow Yield | % | ... | ... | ... | 3.58 | 1.18 | -7.72 | 4.86 | 1.12 |
| other data | Unit | 2001 | 2002 | 2003 | 2004 | 2005 | 2006 | 2007 | 2008 | 2009 | 2010 | 2011 | 2012 | 2013 | 2014 | 2015 |
| other data | ||||||||||||||||
| ROA | % | 16.0 | 19.2 | 14.9 | 10.9 | 11.9 | ||||||||||
| Gross Margin | % | 66.1 | 67.5 | 72.6 | 66.8 | 50.9 | ||||||||||
| Employees | ... | ... | ... | ... | 4,667 | 4,906 | 6,376 | 6,474 | 7,861 | |||||||
| Cost Per Employee | USD per month | ... | ... | ... | ... | 736 | 776 | 792 | 798 | 873 | ||||||
| Cost Per Employee (Local Currency) | PLN per month | ... | ... | ... | ... | 2,292 | 2,341 | 2,349 | 2,598 | 2,760 | ||||||
| Staff Cost (As % Of Total Cost) | % | ... | ... | ... | ... | 15.8 | 15.4 | 19.4 | 17.3 | 17.6 | ||||||
| Effective Tax Rate | % | 16.1 | 3.88 | 18.9 | 15.8 | 17.2 | ||||||||||
| Enterprise Value (EV) | USD mil | ... | ... | ... | 672 | 905 | 595 | 959 | 1,547 | |||||||
| EV/EBITDA | ... | ... | ... | 16.6 | 17.7 | 9.37 | 16.7 | 24.0 | ||||||||
| EV/Capital Employed | ... | ... | ... | 4.48 | 5.61 | 2.61 | 4.06 | 6.19 | ||||||||
| EV/Sales | ... | ... | ... | 2.27 | 2.65 | 1.62 | 2.37 | 2.98 | ||||||||
| EV/EBIT | ... | ... | ... | 19.4 | 20.7 | 10.8 | 21.1 | 29.2 | ||||||||
| Capital Expenditures (As % of Sales) | % | 5.02 | 5.89 | 10.7 | 4.11 | 6.05 | ||||||||||
| Sales from Retail Sales | PLN mil | ... | ... | ... | ... | ... | ... | ... | ... | 749 | 854 | 903 | 1,119 | 1,565 | ||
| Sales from Franchise and Other | PLN mil | ... | ... | ... | ... | ... | ... | ... | ... | 134 | 144 | 136 | 140 | 78.4 | ||
| Sales of Women's Footwear | PLN mil | ... | ... | 545 | 605 | 621 | 721 | ... | ... | ... | ||||||
| Sales of Men's Footwear | PLN mil | ... | ... | 168 | 190 | 186 | 261 | ... | ... | ... | ||||||
| Sales of Childern's Footwear | PLN mil | ... | ... | 128 | 141 | 162 | 182 | ... | ... | ... | ||||||
| Number of Stores | ... | ... | ... | ... | ... | ... | ... | ... | ... | ... | 714 | 709 | ... | ... | ... | |
| Sales in Poland | PLN mil | ... | ... | ... | ... | ... | ... | ... | ... | ... | ... | ... | ... | ... | ||
| Sales in the CEE | PLN mil | ... | ... | ... | ... | ... | ... | ... | ... | ... | ... | ... | ... | ... | ||
| Sales in the Western Europe | PLN mil | ... | ... | ... | ... | ... | ... | ... | ... | ... | ... | ... | ... | ... | ||
| Sales in Other Countries | PLN mil | ... | ... | ... | ... | ... | ... | ... | ... | ... | ... | ... | ... | ... |
Get all company financials in excel:

CCC SA is a Poland-based footwear retail company. The Company produces and sells various models and brands of shoes, including sport footwear, children, female and male shoes. It offers also accessories and garments. The Company carries out sales in its own locations in Poland and the Czech Republic, Slovakia, and Hungary as well as through chains: CCC, BOTI, QUAZI and LASOCKI. Apart from the Central Europe, the CCC Group is present in Romania, Latvia, Ukraine, Kazakhstan and Russia. Within one year, the Company offers nearly three thousand models of shoes. Since 2004, CCC SA stocks are listed in the Warsaw Stock Exchange.
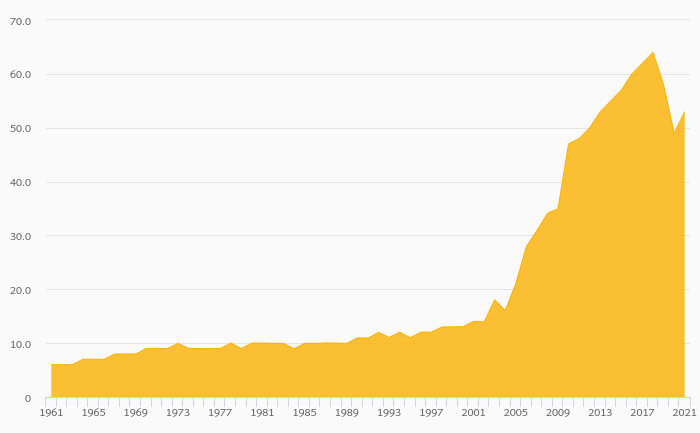
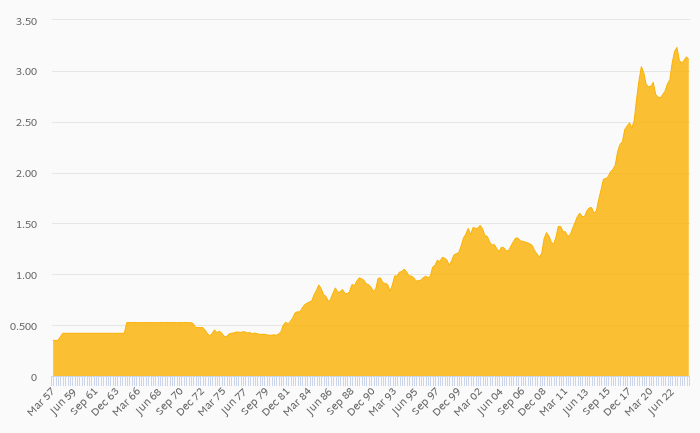
CCC has been growing its sales by a year on average in the last 5 years. EBITDA has grown on average by 16% a year during that time to total of PLN 324 mil in 2015, or 14.0% of sales. That’s compared to 14.5% average margin seen in last five years.
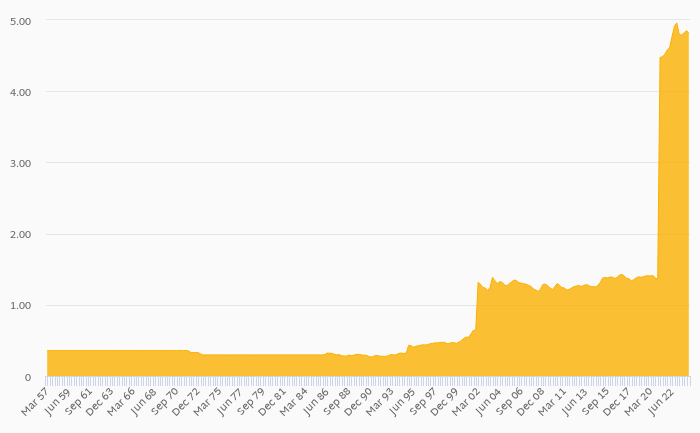
The company netted PLN 259 mil in 2015 implying ROE of 25.0% and ROCE of 17.4%. Again, the average figures were 29.9% and 21.4%, respectively when looking at the previous 5 years.
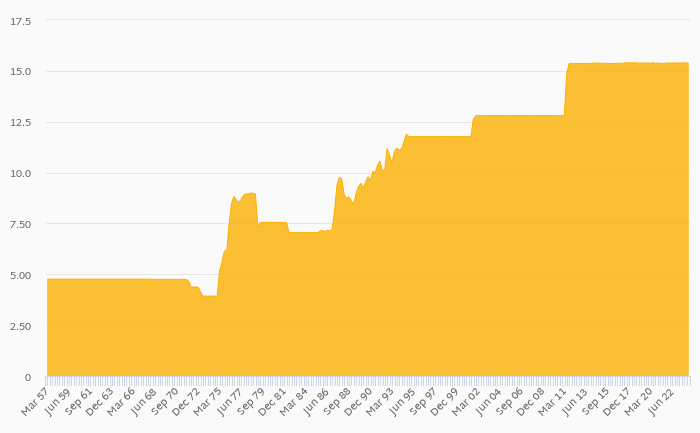
CCC’s net debt amounted to PLN 360 mil at the end of 2015, or 0.321 of equity. When compared to EBITDA, net debt was 1.11x, down when compared to average of 1.12x seen in the last 5 years.
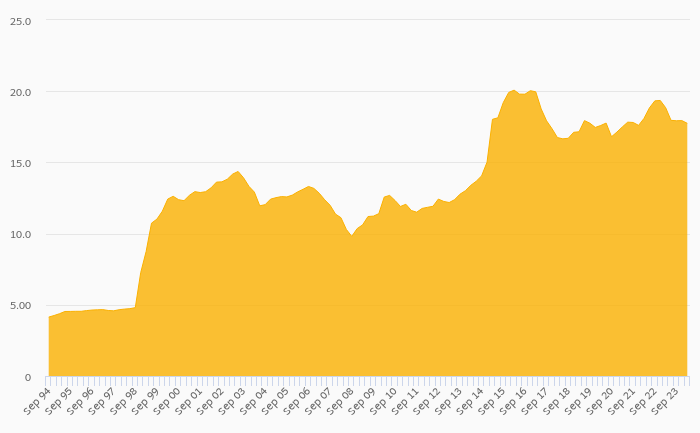
CCC stock traded at PLN 139 per share at the end of 2015 resulting in a market capitalization of USD 1,364 mil. Over the previous five years, stock price grew by 104% or 15.3% a year on average. The closing price put stock at a 12-month trailing EV/EBITDA of 16.7x and price to earnings (PE) of 20.5x as of 2015.
 Helgi Library