By Helgi Library - October 23, 2019
Cofidis Group made a net profit of EUR 220 mil under revenues of EUR 1,254 mil in 2017, up 18.3% and 3.57% respectively compared to t...
By Helgi Library - August 27, 2019
Cofidis Group's non-performing loans reached 19.8% of total loans at the end of 2017, down from 21.9% compared to the previous ye...
By Helgi Library - October 23, 2019
Cofidis Group's net interest margin amounted to 8.23% in 2017, down from 8.42% compared to the previous year. Historically...
| Profit Statement | 2015 | 2016 | 2017 | |
| Net Interest Income | EUR mil | 935 | 973 | 1,014 |
| Net Fee Income | EUR mil | 226 | 236 | 238 |
| Other Income | EUR mil | 3.33 | 2.47 | 2.33 |
| Total Revenues | EUR mil | 1,164 | 1,211 | 1,254 |
| Staff Cost | EUR mil | 230 | 240 | 250 |
| Operating Profit | EUR mil | 561 | 556 | 613 |
| Provisions | EUR mil | 328 | 287 | 294 |
| Net Profit | EUR mil | 147 | 186 | 220 |
| Balance Sheet | 2015 | 2016 | 2017 | |
| Interbank Loans | EUR mil | 591 | 1,200 | 997 |
| Customer Loans | EUR mil | 9,622 | 10,088 | 10,895 |
| Total Assets | EUR mil | 11,036 | 12,058 | 12,591 |
| Shareholders' Equity | EUR mil | 1,362 | 1,412 | 1,636 |
| Interbank Borrowing | EUR mil | 8,737 | 9,751 | 9,992 |
| Customer Deposits | EUR mil | 406 | 402 | 431 |
| Issued Debt Securities | EUR mil | 149 | 111 | 178 |
| Ratios | 2015 | 2016 | 2017 | |
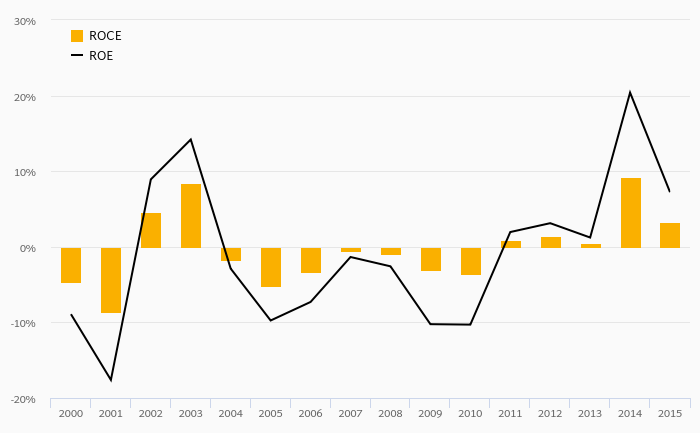
| ROE | % | 11.1 | 13.4 | 14.5 |
| ROA | % | 1.39 | 1.61 | 1.79 |
| Costs (As % Of Assets) | % | 5.68 | 5.67 | 5.20 |
| Costs (As % Of Income) | % | 51.8 | 54.1 | 51.1 |
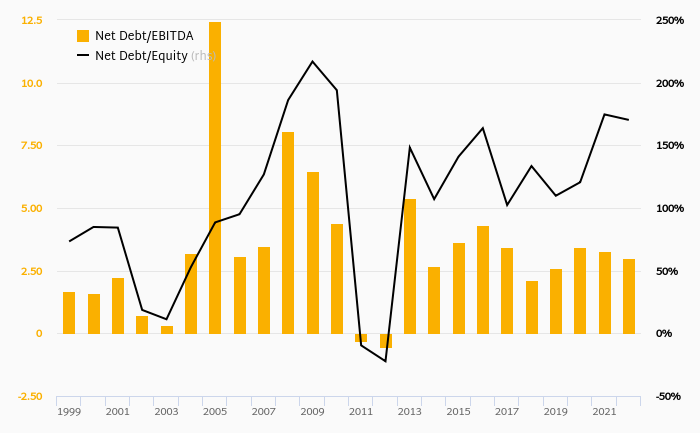
| Capital Adequacy Ratio | % | 9.55 | 11.0 | 12.5 |
| Net Interest Margin | % | 8.81 | 8.42 | 8.23 |
| Loans (As % Of Deposits) | % | 2,370 | 2,508 | 2,529 |
| NPLs (As % Of Loans) | % | 24.4 | 21.9 | 19.8 |
| Provisions (As % Of NPLs) | % | 61.7 | 62.9 | 63.9 |
| Growth Rates | 2015 | 2016 | 2017 | |
| Total Revenue Growth | % | 1.52 | 4.07 | 3.57 |
| Operating Cost Growth | % | 1.35 | 8.59 | -2.11 |
| Operating Profit Growth | % | 1.70 | -0.794 | 10.3 |
| Net Profit Growth | % | 10.8 | 26.5 | 18.3 |
| Customer Loan Growth | % | 7.19 | 4.84 | 8.00 |
| Total Asset Growth | % | 8.30 | 9.26 | 4.42 |
| Customer Deposit Growth | % | -15.0 | -0.914 | 7.12 |
| Shareholders' Equity Growth | % | 6.38 | 3.64 | 15.8 |
| Employees | 4,752 | 4,845 | 4,891 | |
Get all company financials in excel:
| summary | Unit | 2004 | 2005 | 2006 | 2007 | 2008 | 2009 | 2010 | 2011 | 2012 | 2013 | 2014 | 2015 | 2016 | 2017 |
| income statement | |||||||||||||||
| Net Interest Income | EUR mil | ... | ... | ... | ... | 911 | 849 | 888 | 919 | 935 | |||||
| Total Revenues | EUR mil | ... | ... | ... | ... | 1,128 | 1,052 | 1,101 | 1,146 | 1,164 | |||||
| Operating Profit | EUR mil | ... | ... | ... | ... | 606 | 521 | 540 | 551 | 561 | |||||
| Net Profit | EUR mil | ... | ... | ... | ... | 131 | 104 | 115 | 133 | 147 | |||||
| balance sheet | |||||||||||||||
| Interbank Loans | EUR mil | ... | ... | ... | ... | 1,614 | 1,417 | 689 | 672 | 591 | |||||
| Customer Loans | EUR mil | ... | ... | ... | ... | 7,638 | 7,728 | 8,969 | 8,977 | 9,622 | |||||
| Debt Securities | EUR mil | ... | ... | ... | ... | 89.7 | 111 | 98.7 | 133 | 108 | |||||
| Total Assets | EUR mil | ... | ... | ... | ... | 9,794 | 9,671 | 10,196 | 10,190 | 11,036 | |||||
| Shareholders' Equity | EUR mil | ... | ... | 1,147 | 1,171 | 1,256 | 1,281 | 1,362 | |||||||
| Interbank Borrowing | EUR mil | ... | ... | ... | ... | 4,050 | 5,469 | 7,561 | 7,999 | 8,737 | |||||
| Customer Deposits | EUR mil | ... | ... | ... | ... | 498 | 665 | 575 | 478 | 406 | |||||
| Issued Debt Securities | EUR mil | ... | ... | ... | ... | 3,857 | 2,141 | 539 | 143 | 149 | |||||
| ratios | |||||||||||||||
| ROE | % | ... | ... | ... | ... | 11.8 | 8.94 | 9.49 | 10.5 | 11.1 | |||||
| ROA | % | ... | ... | ... | ... | 1.38 | 1.06 | 1.16 | 1.30 | 1.39 | |||||
| Costs (As % Of Assets) | % | ... | ... | ... | ... | 5.49 | 5.46 | 5.65 | 5.84 | 5.68 | |||||
| Costs (As % Of Income) | % | ... | ... | ... | ... | 46.3 | 50.5 | 51.0 | 51.9 | 51.8 | |||||
| Capital Adequacy Ratio | % | ... | ... | 10.0 | 10.1 | 9.80 | 9.18 | 9.55 | |||||||
| Net Interest Margin | % | ... | ... | ... | ... | 9.57 | 8.72 | 8.94 | 9.02 | 8.81 | |||||
| Interest Income (As % Of Revenues) | % | ... | ... | ... | ... | 80.8 | 80.6 | 80.7 | 80.2 | 80.3 | |||||
| Fee Income (As % Of Revenues) | % | ... | ... | ... | ... | 18.8 | 18.7 | 19.1 | 19.4 | 19.4 | |||||
| Staff Cost (As % Of Total Cost) | % | ... | ... | ... | ... | 41.8 | 39.6 | 38.1 | 36.9 | 38.0 | |||||
| Equity (As % Of Assets) | % | ... | ... | ... | ... | 11.7 | 12.1 | 12.3 | 12.6 | 12.3 | |||||
| Loans (As % Of Deposits) | % | ... | ... | ... | ... | 1,535 | 1,162 | 1,560 | 1,879 | 2,370 | |||||
| Loans (As % Assets) | % | ... | ... | ... | ... | 78.0 | 79.9 | 88.0 | 88.1 | 87.2 | |||||
| NPLs (As % Of Loans) | % | ... | ... | ... | ... | ... | ... | 26.7 | 25.8 | 23.7 | 24.3 | 24.4 | |||
| Provisions (As % Of NPLs) | % | ... | ... | ... | ... | ... | ... | 63.5 | 63.1 | 64.1 | 63.0 | 61.7 | |||
| valuation | |||||||||||||||
| Book Value Per Share Growth | % | ... | ... | ... | ... | ... | ... | -6.16 | -6.82 | 4.64 | 3.51 | 1.68 |
| income statement | Unit | 2004 | 2005 | 2006 | 2007 | 2008 | 2009 | 2010 | 2011 | 2012 | 2013 | 2014 | 2015 | 2016 | 2017 |
| income statement | |||||||||||||||
| Interest Income | EUR mil | ... | ... | ... | ... | 1,156 | 1,009 | 1,029 | 1,049 | 1,036 | |||||
| Interest Cost | EUR mil | ... | ... | ... | ... | 245 | 160 | 141 | 130 | 101 | |||||
| Net Interest Income | EUR mil | ... | ... | ... | ... | 911 | 849 | 888 | 919 | 935 | |||||
| Net Fee Income | EUR mil | ... | ... | ... | ... | 212 | 197 | 210 | 222 | 226 | |||||
| Other Income | EUR mil | ... | ... | ... | ... | 5.12 | 6.64 | 3.00 | 5.42 | 3.33 | |||||
| Total Revenues | EUR mil | ... | ... | ... | ... | 1,128 | 1,052 | 1,101 | 1,146 | 1,164 | |||||
| Staff Cost | EUR mil | ... | ... | ... | ... | 218 | 210 | 213 | 219 | 230 | |||||
| Depreciation | EUR mil | ... | ... | ... | ... | 14.9 | 13.7 | 16.2 | 8.94 | 10.0 | |||||
| Other Cost | EUR mil | ... | ... | ... | ... | 289 | 307 | 331 | 367 | 364 | |||||
| Operating Cost | EUR mil | ... | ... | ... | ... | 522 | 531 | 561 | 595 | 603 | |||||
| Operating Profit | EUR mil | ... | ... | ... | ... | 606 | 521 | 540 | 551 | 561 | |||||
| Provisions | EUR mil | ... | ... | ... | ... | 412 | 363 | 366 | 354 | 328 | |||||
| Extra and Other Cost | EUR mil | ... | ... | ... | ... | 2.35 | 0.492 | 1.73 | 0.289 | 16.3 | |||||
| Pre-Tax Profit | EUR mil | ... | ... | ... | ... | 192 | 157 | 172 | 197 | 216 | |||||
| Tax | EUR mil | ... | ... | ... | ... | 60.8 | 53.6 | 57.0 | 64.0 | 68.9 | |||||
| Minorities | EUR mil | ... | ... | ... | ... | 0 | 0.022 | -0.012 | 0 | 0 | |||||
| Net Profit | EUR mil | ... | ... | ... | ... | 131 | 104 | 115 | 133 | 147 | |||||
| growth rates | |||||||||||||||
| Net Interest Income Growth | % | ... | ... | ... | ... | ... | ... | -6.16 | -6.82 | 4.64 | 3.51 | 1.68 | |||
| Net Fee Income Growth | % | ... | ... | ... | ... | ... | ... | -7.47 | -7.00 | 6.63 | 5.70 | 1.80 | |||
| Total Revenue Growth | % | ... | ... | ... | ... | ... | ... | -6.13 | -6.69 | 4.64 | 4.14 | 1.52 | |||
| Operating Cost Growth | % | ... | ... | ... | ... | ... | ... | 7.70 | 1.74 | 5.62 | 6.09 | 1.35 | |||
| Operating Profit Growth | % | ... | ... | ... | ... | ... | ... | -15.5 | -14.0 | 3.64 | 2.11 | 1.70 | |||
| Pre-Tax Profit Growth | % | ... | ... | ... | ... | ... | ... | -10.1 | -18.0 | 9.53 | 14.5 | 9.77 | |||
| Net Profit Growth | % | ... | ... | ... | ... | ... | ... | -5.77 | -20.9 | 11.2 | 15.5 | 10.8 |
| balance sheet | Unit | 2004 | 2005 | 2006 | 2007 | 2008 | 2009 | 2010 | 2011 | 2012 | 2013 | 2014 | 2015 | 2016 | 2017 |
| balance sheet | |||||||||||||||
| Cash | EUR mil | ... | ... | ... | ... | 3.91 | 2.21 | 0.919 | 0.829 | 0.396 | |||||
| Interbank Loans | EUR mil | ... | ... | ... | ... | 1,614 | 1,417 | 689 | 672 | 591 | |||||
| Customer Loans | EUR mil | ... | ... | ... | ... | 7,638 | 7,728 | 8,969 | 8,977 | 9,622 | |||||
| Debt Securities | EUR mil | ... | ... | ... | ... | 89.7 | 111 | 98.7 | 133 | 108 | |||||
| Fixed Assets | EUR mil | ... | ... | ... | ... | 59.7 | 50.6 | 42.4 | 45.5 | 156 | |||||
| Total Assets | EUR mil | ... | ... | ... | ... | 9,794 | 9,671 | 10,196 | 10,190 | 11,036 | |||||
| Shareholders' Equity | EUR mil | ... | ... | 1,147 | 1,171 | 1,256 | 1,281 | 1,362 | |||||||
| Of Which Minority Interest | EUR mil | ... | ... | ... | ... | 0.096 | 0.027 | 0.008 | 0.003 | 0.003 | |||||
| Liabilities | EUR mil | ... | ... | ... | ... | 8,648 | 8,500 | 8,940 | 8,909 | 9,674 | |||||
| Interbank Borrowing | EUR mil | ... | ... | ... | ... | 4,050 | 5,469 | 7,561 | 7,999 | 8,737 | |||||
| Customer Deposits | EUR mil | ... | ... | ... | ... | 498 | 665 | 575 | 478 | 406 | |||||
| Issued Debt Securities | EUR mil | ... | ... | ... | ... | 3,857 | 2,141 | 539 | 143 | 149 | |||||
| Other Liabilities | EUR mil | ... | ... | ... | ... | 243 | 225 | 265 | 290 | 381 | |||||
| asset quality | |||||||||||||||
| Non-Performing Loans | EUR mil | ... | ... | ... | ... | ... | ... | 2,451 | 2,386 | 2,505 | 2,579 | 2,758 | |||
| Gross Loans | EUR mil | ... | ... | 9,194 | 9,234 | 10,574 | 10,602 | 11,323 | |||||||
| Total Provisions | EUR mil | ... | ... | ... | ... | 1,556 | 1,506 | 1,605 | 1,625 | 1,701 | |||||
| growth rates | |||||||||||||||
| Customer Loan Growth | % | ... | ... | ... | ... | ... | ... | 0.820 | 1.17 | 16.1 | 0.089 | 7.19 | |||
| Total Asset Growth | % | ... | ... | ... | ... | ... | ... | 6.10 | -1.26 | 5.42 | -0.056 | 8.30 | |||
| Shareholders' Equity Growth | % | ... | ... | ... | ... | 6.47 | 2.10 | 7.29 | 1.97 | 6.38 | |||||
| Customer Deposit Growth | % | ... | ... | ... | ... | ... | ... | 27.2 | 33.6 | -13.5 | -16.9 | -15.0 |
| ratios | Unit | 2004 | 2005 | 2006 | 2007 | 2008 | 2009 | 2010 | 2011 | 2012 | 2013 | 2014 | 2015 | 2016 | 2017 |
| ratios | |||||||||||||||
| ROE | % | ... | ... | ... | ... | 11.8 | 8.94 | 9.49 | 10.5 | 11.1 | |||||
| ROA | % | ... | ... | ... | ... | 1.38 | 1.06 | 1.16 | 1.30 | 1.39 | |||||
| Costs (As % Of Assets) | % | ... | ... | ... | ... | 5.49 | 5.46 | 5.65 | 5.84 | 5.68 | |||||
| Costs (As % Of Income) | % | ... | ... | ... | ... | 46.3 | 50.5 | 51.0 | 51.9 | 51.8 | |||||
| Capital Adequacy Ratio | % | ... | ... | 10.0 | 10.1 | 9.80 | 9.18 | 9.55 | |||||||
| Tier 1 Ratio | % | ... | ... | ... | ... | ... | ... | ... | ... | ... | ... | ... | ... | ||
| Net Interest Margin | % | ... | ... | ... | ... | 9.57 | 8.72 | 8.94 | 9.02 | 8.81 | |||||
| Interest Spread | % | ... | ... | ... | ... | ... | ... | 9.23 | 8.50 | 8.74 | 8.84 | 8.67 | |||
| Asset Yield | % | ... | ... | ... | ... | 12.2 | 10.4 | 10.4 | 10.3 | 9.76 | |||||
| Cost Of Liabilities | % | ... | ... | ... | ... | ... | ... | 2.92 | 1.87 | 1.62 | 1.45 | 1.09 | |||
| Interest Income (As % Of Revenues) | % | ... | ... | ... | ... | 80.8 | 80.6 | 80.7 | 80.2 | 80.3 | |||||
| Fee Income (As % Of Revenues) | % | ... | ... | ... | ... | 18.8 | 18.7 | 19.1 | 19.4 | 19.4 | |||||
| Other Income (As % Of Revenues) | % | ... | ... | ... | ... | 0.454 | 0.631 | 0.272 | 0.473 | 0.286 | |||||
| Cost Per Employee | USD per month | ... | ... | ... | ... | ... | ... | 5,867 | 5,437 | 5,399 | 5,454 | 4,614 | |||
| Cost Per Employee (Local Currency) | EUR per month | ... | ... | ... | ... | ... | ... | 4,219 | 4,235 | 4,067 | 4,231 | 4,025 | |||
| Staff Cost (As % Of Total Cost) | % | ... | ... | ... | ... | 41.8 | 39.6 | 38.1 | 36.9 | 38.0 | |||||
| Equity (As % Of Assets) | % | ... | ... | ... | ... | 11.7 | 12.1 | 12.3 | 12.6 | 12.3 | |||||
| Loans (As % Of Deposits) | % | ... | ... | ... | ... | 1,535 | 1,162 | 1,560 | 1,879 | 2,370 | |||||
| Loans (As % Assets) | % | ... | ... | ... | ... | 78.0 | 79.9 | 88.0 | 88.1 | 87.2 | |||||
| NPLs (As % Of Loans) | % | ... | ... | ... | ... | ... | ... | 26.7 | 25.8 | 23.7 | 24.3 | 24.4 | |||
| Provisions (As % Of NPLs) | % | ... | ... | ... | ... | ... | ... | 63.5 | 63.1 | 64.1 | 63.0 | 61.7 | |||
| Provisions (As % Of Loans) | % | ... | ... | ... | ... | 20.4 | 19.5 | 17.9 | 18.1 | 17.7 | |||||
| Cost of Provisions (As % Of Loans) | % | ... | ... | ... | ... | 5.41 | 4.73 | 4.39 | 3.95 | 3.53 |
| other data | Unit | 2004 | 2005 | 2006 | 2007 | 2008 | 2009 | 2010 | 2011 | 2012 | 2013 | 2014 | 2015 | 2016 | 2017 |
| other data | |||||||||||||||
| Employees | ... | ... | ... | ... | ... | ... | 4,308 | 4,136 | 4,374 | 4,320 | 4,752 |
Get all company financials in excel:


By Helgi Library - October 23, 2019
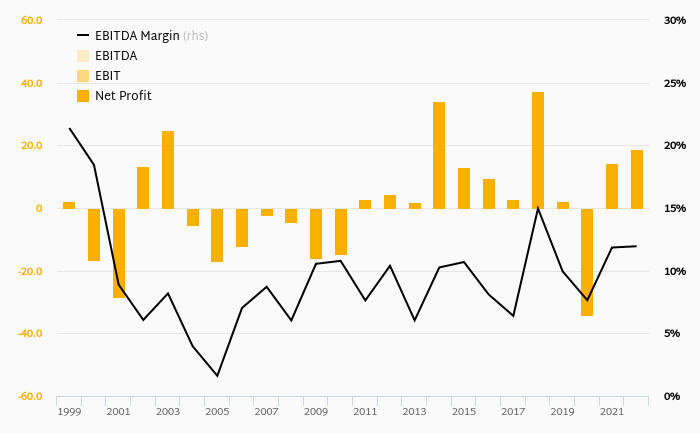
Cofidis Group generated total banking revenues of EUR 1,254 mil in 2017, up 3.57% compared to the previous year. Historically, the bank’s revenues containing of interest, fee and other non-interest income reached an all time high of EUR 1,254 mil in 2017 and an...
By Helgi Library - October 23, 2019
Cofidis Group's customer loan growth reached 8.00% in 2017, up from 4.84% compared to the previous year. Historically, the bank’s loans growth reached an all time high of 40.0% in 2005 and an all time low of 0.089% in 2014. In the last decade, the average...
By Helgi Library - October 23, 2019
Cofidis Group's customer loans reached in, down 0% compared to the previous year. French banking sector provided customer loans of EUR bil in, down 0% when compared to the last year. Cofidis Group accounted for of all customer loans issued in Franc...
By Helgi Library - October 23, 2019
Cofidis Group's customer deposits reached in, down 0% compared to the previous year. French banking sector accepted customer deposits of EUR bil in, down 0% when compared to the last year. Cofidis Group accounted for of all customer deposits taken by b...
By Helgi Library - October 23, 2019
Cofidis Group generated total banking revenues of in, down 0% compared to the previous year. French banking sector banking sector generated total revenues of EUR mil in, down 0% when compared to the last year. As a result, Cofidis Group accoun...

Cofidis Group has been growing its revenues and asset by 3.58% and 5.42% a year on average in the last 5 years. Its loans and deposits have grown by 7.11% and -8.31% a year during that time and loans to deposits ratio reached 2,529% at the end of 2017. The company achieved an average return on equity of 11.8% in the last five years with net profit growing 16.3% a year on average. In terms of operating efficiency, its cost to income ratio reached 51.1% in 2017, compared to 52.0% average in the last five years.
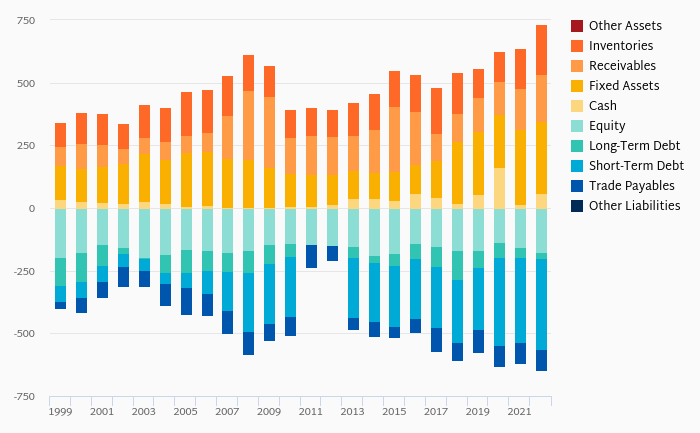
Equity represented 13.0% of total assets or 15.0% of loans at the end of 2017. Cofidis Group's non-performing loans were 19.8% of total loans while provisions covered some 63.9% of NPLs at the end of 2017.
 Helgi Library