By Helgi Library - April 2, 2020
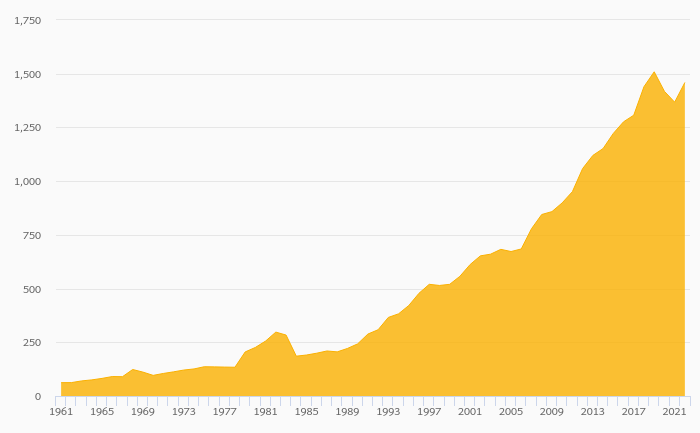
Gorenje's total assets reached EUR 1,101 mil at the end of 2015, down 0.103% compared to the previous year. Curren...
| Profit Statement | 2013 | 2014 | 2015 | |
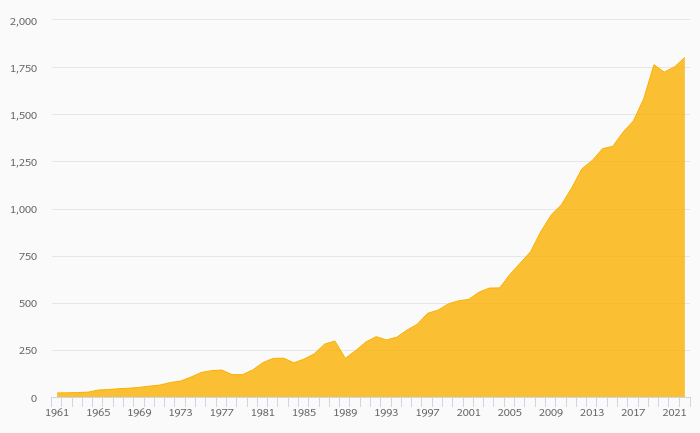
| Sales | EUR mil | 1,240 | 1,254 | 1,225 |
| Gross Profit | EUR mil | 330 | 316 | 297 |
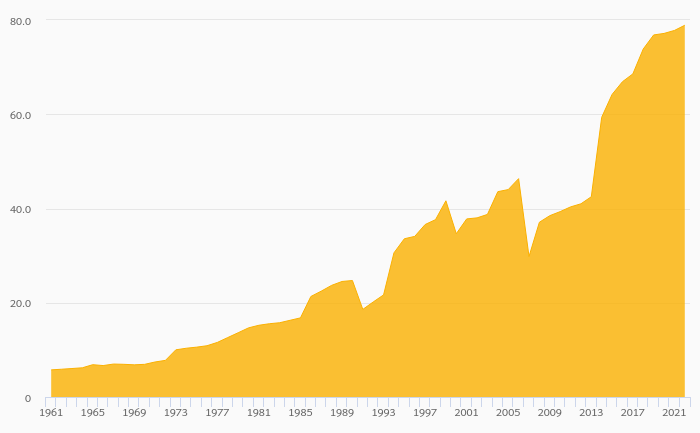
| EBITDA | EUR mil | 78.2 | 85.6 | 80.1 |
| EBIT | EUR mil | 36.3 | 42.5 | 34.4 |
| Financing Cost | EUR mil | 54.4 | 38.7 | 38.8 |
| Pre-Tax Profit | EUR mil | -18.6 | 3.86 | -3.99 |
| Net Profit | EUR mil | -25.2 | 1.02 | -8.20 |
| Dividends | EUR mil | 1.46 | 0 | ... |
| Balance Sheet | 2013 | 2014 | 2015 | |
| Total Assets | EUR mil | 1,150 | 1,102 | 1,101 |
| Non-Current Assets | EUR mil | 596 | 595 | 614 |
| Current Assets | EUR mil | 554 | 508 | 487 |
| Working Capital | EUR mil | 228 | 200 | 166 |
| Shareholders' Equity | EUR mil | 381 | 377 | 365 |
| Liabilities | EUR mil | 769 | 725 | 736 |
| Total Debt | EUR mil | 397 | 368 | 362 |
| Net Debt | EUR mil | 359 | 332 | 330 |
| Ratios | 2013 | 2014 | 2015 | |
| ROE | % | -6.55 | 0.269 | -2.21 |
| ROCE | % | -3.07 | 0.126 | -1.04 |
| Gross Margin | % | 26.6 | 25.2 | 24.3 |
| EBITDA Margin | % | 6.30 | 6.82 | 6.54 |
| EBIT Margin | % | 2.93 | 3.39 | 2.81 |
| Net Margin | % | -2.03 | 0.081 | -0.670 |
| Net Debt/EBITDA | 4.59 | 3.88 | 4.13 | |
| Net Debt/Equity | 0.943 | 0.878 | 0.905 | |
| Cost of Financing | % | 13.1 | 10.1 | 10.6 |
| Valuation | 2013 | 2014 | 2015 | |
| Market Capitalisation | USD mil | 125 | 166 | 136 |
| Enterprise Value (EV) | USD mil | 620 | 567 | 536 |
| Number Of Shares | mil | 22.1 | 24.4 | 24.4 |
| Share Price | EUR | 4.10 | 5.62 | 4.60 |
| EV/EBITDA | 5.97 | 5.15 | 5.19 | |
| EV/Sales | 0.376 | 0.351 | 0.339 | |
| Price/Earnings (P/E) | -3.59 | 135 | -13.7 | |
| Price/Book Value (P/BV) | 0.238 | 0.364 | 0.308 | |
| Dividend Yield | % | 1.61 | 0 | ... |
Get all company financials in excel:
| summary | Unit | 1997 | 1998 | 1999 | 2000 | 2001 | 2002 | 2003 | 2004 | 2005 | 2006 | 2007 | 2008 | 2009 | 2010 | 2011 | 2012 | 2013 | 2014 | 2015 |
| income statement | ||||||||||||||||||||
| Sales | EUR mil | ... | 1,186 | 1,382 | 1,422 | 1,263 | 1,240 | |||||||||||||
| Gross Profit | EUR mil | ... | 285 | 342 | 317 | 317 | 330 | |||||||||||||
| EBIT | EUR mil | ... | 12.1 | 56.4 | 36.5 | 44.9 | 36.3 | |||||||||||||
| Net Profit | EUR mil | ... | -11.5 | 19.9 | 8.97 | 8.94 | -25.2 | |||||||||||||
| ROE | % | ... | -3.01 | 5.23 | 2.27 | 2.27 | -6.55 | |||||||||||||
| EBIT Margin | % | ... | 1.02 | 4.08 | 2.57 | 3.56 | 2.93 | |||||||||||||
| Net Margin | % | ... | -0.970 | 1.44 | 0.630 | 0.707 | -2.03 | |||||||||||||
| Employees | 10,907 | 11,174 | 10,932 | 10,388 | 10,730 | |||||||||||||||
| balance sheet | ||||||||||||||||||||
| Total Assets | EUR mil | ... | 1,179 | 1,318 | 1,252 | 1,197 | 1,150 | |||||||||||||
| Non-Current Assets | EUR mil | ... | 574 | 563 | 556 | 566 | 596 | |||||||||||||
| Current Assets | EUR mil | ... | 604 | 754 | 695 | 631 | 554 | |||||||||||||
| Shareholders' Equity | EUR mil | ... | 370 | 392 | 398 | 390 | 381 | |||||||||||||
| Liabilities | EUR mil | ... | 809 | 926 | 854 | 807 | 769 | |||||||||||||
| Non-Current Liabilities | EUR mil | ... | 311 | 356 | 385 | 354 | 281 | |||||||||||||
| Current Liabilities | EUR mil | ... | 498 | 570 | 469 | 456 | 488 | |||||||||||||
| Net Debt/EBITDA | ... | 8.93 | 3.69 | 4.35 | 4.19 | 4.59 | ||||||||||||||
| Net Debt/Equity | ... | 1.27 | 1.02 | 0.948 | 0.973 | 0.943 | ||||||||||||||
| Cost of Financing | % | ... | ... | 4.45 | 6.93 | 5.28 | 6.68 | 13.1 | ||||||||||||
| cash flow | ||||||||||||||||||||
| Total Cash From Operations | EUR mil | ... | 65.6 | 27.7 | 22.1 | 49.7 | 50.7 | |||||||||||||
| Total Cash From Investing | EUR mil | ... | -19.5 | -17.7 | -33.3 | -46.7 | -58.6 | |||||||||||||
| Total Cash From Financing | EUR mil | ... | -43.1 | 45.6 | 30.1 | -53.1 | -7.28 | |||||||||||||
| Net Change In Cash | EUR mil | ... | 3.02 | 55.6 | 18.9 | -50.1 | -15.1 | |||||||||||||
| valuation | ||||||||||||||||||||
| Market Capitalisation | USD mil | ... | ... | ... | 249 | 266 | 101 | 78.2 | 125 | |||||||||||
| Number Of Shares | mil | ... | ... | ... | 14.1 | 15.1 | 15.9 | 15.9 | 22.1 | |||||||||||
| Share Price | EUR | ... | ... | ... | 12.3 | 13.3 | 4.92 | 3.73 | 4.10 | |||||||||||
| Earnings Per Share (EPS) | EUR | ... | ... | ... | -0.813 | 1.32 | 0.564 | 0.562 | -1.14 | |||||||||||
| Book Value Per Share | EUR | ... | ... | ... | 26.1 | 26.0 | 25.0 | 24.5 | 17.2 | |||||||||||
| Dividend Per Share | EUR | ... | ... | ... | 0 | 0 | 0.143 | 0 | 0.066 | ... | ||||||||||
| Price/Earnings (P/E) | ... | ... | ... | -15.1 | 10.1 | 8.72 | 6.64 | -3.59 | ||||||||||||
| Price/Book Value (P/BV) | ... | ... | ... | 0.470 | 0.511 | 0.197 | 0.152 | 0.238 | ||||||||||||
| Dividend Yield | % | ... | ... | ... | 0 | 0 | 2.90 | 0 | 1.61 | ... | ||||||||||
| Earnings Per Share Growth | % | ... | ... | ... | ... | -226 | -262 | -57.3 | -0.335 | -303 | ||||||||||
| Book Value Per Share Growth | % | ... | ... | ... | ... | -9.26 | -0.631 | -3.69 | -2.00 | -29.7 |
| income statement | Unit | 1997 | 1998 | 1999 | 2000 | 2001 | 2002 | 2003 | 2004 | 2005 | 2006 | 2007 | 2008 | 2009 | 2010 | 2011 | 2012 | 2013 | 2014 | 2015 |
| income statement | ||||||||||||||||||||
| Sales | EUR mil | ... | 1,186 | 1,382 | 1,422 | 1,263 | 1,240 | |||||||||||||
| Cost of Goods & Services | EUR mil | ... | 901 | 1,041 | 1,105 | 946 | 911 | |||||||||||||
| Gross Profit | EUR mil | ... | 285 | 342 | 317 | 317 | 330 | |||||||||||||
| Staff Cost | EUR mil | ... | 219 | 244 | 266 | 259 | 238 | |||||||||||||
| Other Cost | EUR mil | ... | 13.0 | -11.4 | -35.3 | -32.4 | 13.8 | |||||||||||||
| EBITDA | EUR mil | ... | 52.5 | 109 | 86.7 | 90.6 | 78.2 | |||||||||||||
| Depreciation | EUR mil | ... | 40.4 | 52.2 | 50.2 | 45.7 | 41.9 | |||||||||||||
| EBIT | EUR mil | ... | 12.1 | 56.4 | 36.5 | 44.9 | 36.3 | |||||||||||||
| Financing Cost | EUR mil | ... | 21.5 | 34.0 | 25.4 | 30.4 | 54.4 | |||||||||||||
| Extraordinary Cost | EUR mil | ... | < 0.001 | 0 | 0.009 | -0.301 | 0.592 | |||||||||||||
| Pre-Tax Profit | EUR mil | ... | -9.31 | 22.5 | 11.1 | 14.8 | -18.6 | |||||||||||||
| Tax | EUR mil | ... | 2.92 | 2.45 | 2.01 | 5.63 | 4.22 | |||||||||||||
| Minorities | EUR mil | ... | -0.728 | 0.101 | 0.141 | 0.238 | 0.225 | |||||||||||||
| Net Profit | EUR mil | ... | -11.5 | 19.9 | 8.97 | 8.94 | -25.2 | |||||||||||||
| Dividends | EUR mil | 0 | 0 | 2.27 | 0 | 1.46 | ... | |||||||||||||
| growth rates | ||||||||||||||||||||
| Total Revenue Growth | % | ... | ... | -10.9 | 16.5 | 2.90 | -11.2 | -1.79 | ||||||||||||
| Operating Cost Growth | % | ... | ... | 2.87 | 0.310 | -1.06 | -1.84 | 11.3 | ||||||||||||
| EBITDA Growth | % | ... | ... | -35.2 | 107 | -20.2 | 4.47 | -13.7 | ||||||||||||
| EBIT Growth | % | ... | ... | -67.1 | 365 | -35.3 | 23.0 | -19.1 | ||||||||||||
| Pre-Tax Profit Growth | % | ... | ... | -160 | -341 | -50.6 | 33.2 | -226 | ||||||||||||
| Net Profit Growth | % | ... | ... | -230 | -273 | -55.0 | -0.335 | -382 | ||||||||||||
| ratios | ||||||||||||||||||||
| ROE | % | ... | -3.01 | 5.23 | 2.27 | 2.27 | -6.55 | |||||||||||||
| ROCE | % | ... | ... | -1.32 | 2.30 | 1.02 | 1.06 | -3.07 | ||||||||||||
| Gross Margin | % | ... | 24.0 | 24.7 | 22.3 | 25.1 | 26.6 | |||||||||||||
| EBITDA Margin | % | ... | 4.43 | 7.86 | 6.10 | 7.17 | 6.30 | |||||||||||||
| EBIT Margin | % | ... | 1.02 | 4.08 | 2.57 | 3.56 | 2.93 | |||||||||||||
| Net Margin | % | ... | -0.970 | 1.44 | 0.630 | 0.707 | -2.03 | |||||||||||||
| Payout Ratio | % | ... | 0 | 0 | 25.3 | 0 | -5.78 | ... | ||||||||||||
| Cost of Financing | % | ... | ... | 4.45 | 6.93 | 5.28 | 6.68 | 13.1 | ||||||||||||
| Net Debt/EBITDA | ... | 8.93 | 3.69 | 4.35 | 4.19 | 4.59 |
| balance sheet | Unit | 1997 | 1998 | 1999 | 2000 | 2001 | 2002 | 2003 | 2004 | 2005 | 2006 | 2007 | 2008 | 2009 | 2010 | 2011 | 2012 | 2013 | 2014 | 2015 |
| balance sheet | ||||||||||||||||||||
| Non-Current Assets | EUR mil | ... | 574 | 563 | 556 | 566 | 596 | |||||||||||||
| Property, Plant & Equipment | EUR mil | ... | 383 | 375 | 359 | 341 | 357 | |||||||||||||
| Intangible Assets | EUR mil | ... | 162 | 160 | 159 | 160 | 168 | |||||||||||||
| Current Assets | EUR mil | ... | 604 | 754 | 695 | 631 | 554 | |||||||||||||
| Inventories | EUR mil | ... | 217 | 256 | 246 | 247 | 236 | |||||||||||||
| Receivables | EUR mil | ... | 252 | 306 | 256 | 219 | 206 | |||||||||||||
| Cash & Cash Equivalents | EUR mil | ... | 27.1 | 82.7 | 102 | 53.5 | 38.6 | |||||||||||||
| Total Assets | EUR mil | ... | 1,179 | 1,318 | 1,252 | 1,197 | 1,150 | |||||||||||||
| Shareholders' Equity | EUR mil | ... | 370 | 392 | 398 | 390 | 381 | |||||||||||||
| Of Which Minority Interest | EUR mil | ... | 6.07 | 1.81 | 1.82 | 2.35 | 2.81 | |||||||||||||
| Liabilities | EUR mil | ... | 809 | 926 | 854 | 807 | 769 | |||||||||||||
| Non-Current Liabilities | EUR mil | ... | 311 | 356 | 385 | 354 | 281 | |||||||||||||
| Long-Term Debt | EUR mil | ... | 297 | 261 | 302 | 277 | 199 | |||||||||||||
| Deferred Tax Liabilities | EUR mil | ... | ... | ... | ... | ... | ... | ... | ... | ... | ... | ... | 5.59 | 6.06 | 5.93 | 4.37 | 4.32 | |||
| Current Liabilities | EUR mil | ... | 498 | 570 | 469 | 456 | 488 | |||||||||||||
| Short-Term Debt | EUR mil | ... | 199 | 223 | 176 | 156 | 199 | |||||||||||||
| Trade Payables | EUR mil | ... | 196 | 237 | 194 | 212 | 214 | |||||||||||||
| Provisions | EUR mil | ... | ... | ... | ... | ... | ... | ... | ... | ... | ... | ... | ... | ... | ... | ... | ... | ... | ||
| Equity And Liabilities | EUR mil | ... | 1,179 | 1,318 | 1,252 | 1,197 | 1,150 | |||||||||||||
| growth rates | ||||||||||||||||||||
| Total Asset Growth | % | ... | ... | -6.29 | 11.8 | -5.02 | -4.34 | -3.98 | ||||||||||||
| Shareholders' Equity Growth | % | ... | ... | -6.31 | 6.07 | 1.46 | -2.00 | -2.35 | ||||||||||||
| Net Debt Growth | % | ... | ... | 5.33 | -14.4 | -6.05 | 0.604 | -5.38 | ||||||||||||
| Total Debt Growth | % | ... | ... | 5.70 | -2.44 | -1.11 | -9.58 | -8.16 | ||||||||||||
| ratios | ||||||||||||||||||||
| Total Debt | EUR mil | ... | 496 | 484 | 479 | 433 | 397 | |||||||||||||
| Net Debt | EUR mil | ... | 469 | 401 | 377 | 379 | 359 | |||||||||||||
| Working Capital | EUR mil | ... | 272 | 325 | 307 | 253 | 228 | |||||||||||||
| Capital Employed | EUR mil | ... | 846 | 889 | 864 | 820 | 823 | |||||||||||||
| Net Debt/Equity | ... | 1.27 | 1.02 | 0.948 | 0.973 | 0.943 | ||||||||||||||
| Cost of Financing | % | ... | ... | 4.45 | 6.93 | 5.28 | 6.68 | 13.1 |
| cash flow | Unit | 1997 | 1998 | 1999 | 2000 | 2001 | 2002 | 2003 | 2004 | 2005 | 2006 | 2007 | 2008 | 2009 | 2010 | 2011 | 2012 | 2013 | 2014 | 2015 |
| cash flow | ||||||||||||||||||||
| Net Profit | EUR mil | ... | -11.5 | 19.9 | 8.97 | 8.94 | -25.2 | |||||||||||||
| Depreciation | EUR mil | ... | 40.4 | 52.2 | 50.2 | 45.7 | 41.9 | |||||||||||||
| Non-Cash Items | EUR mil | ... | ... | 20.8 | 8.65 | -55.1 | -58.8 | 8.17 | ||||||||||||
| Change in Working Capital | EUR mil | ... | ... | 15.9 | -53.1 | 17.9 | 53.8 | 25.9 | ||||||||||||
| Total Cash From Operations | EUR mil | ... | 65.6 | 27.7 | 22.1 | 49.7 | 50.7 | |||||||||||||
| Capital Expenditures | EUR mil | ... | -24.2 | -39.4 | -41.1 | -53.5 | -60.9 | |||||||||||||
| Other Investments | EUR mil | ... | 4.74 | 21.7 | 7.84 | 6.88 | 2.37 | |||||||||||||
| Total Cash From Investing | EUR mil | ... | -19.5 | -17.7 | -33.3 | -46.7 | -58.6 | |||||||||||||
| Dividends Paid | EUR mil | 0 | 0 | -2.27 | 0 | -1.46 | ... | |||||||||||||
| Issuance Of Debt | EUR mil | ... | ... | 26.7 | -12.1 | -5.37 | -45.9 | -35.3 | ||||||||||||
| Total Cash From Financing | EUR mil | ... | -43.1 | 45.6 | 30.1 | -53.1 | -7.28 | |||||||||||||
| Net Change In Cash | EUR mil | ... | 3.02 | 55.6 | 18.9 | -50.1 | -15.1 | |||||||||||||
| ratios | ||||||||||||||||||||
| Days Sales Outstanding | days | ... | 77.5 | 80.9 | 65.7 | 63.1 | 60.5 | |||||||||||||
| Days Sales Of Inventory | days | ... | 87.8 | 89.8 | 81.1 | 95.4 | 94.5 | |||||||||||||
| Days Payable Outstanding | days | ... | 79.5 | 83.1 | 64.2 | 81.9 | 85.7 | |||||||||||||
| Cash Conversion Cycle | days | ... | 85.7 | 87.5 | 82.6 | 76.6 | 69.3 | |||||||||||||
| Cash Earnings | EUR mil | ... | 28.9 | 72.2 | 59.2 | 54.6 | 16.7 | |||||||||||||
| Cash Earnings Per Share | EUR | ... | ... | ... | 2.04 | 4.78 | 3.72 | 3.43 | 0.753 | |||||||||||
| Price/Cash Earnings (P/CE) | ... | ... | ... | 6.02 | 2.78 | 1.32 | 1.09 | 5.44 | ||||||||||||
| Free Cash Flow | EUR mil | ... | 46.1 | 10.0 | -11.2 | 3.01 | -7.81 | |||||||||||||
| Free Cash Flow Yield | % | ... | ... | ... | 25.8 | 4.99 | -15.4 | 4.94 | -8.30 |
| other data | Unit | 1997 | 1998 | 1999 | 2000 | 2001 | 2002 | 2003 | 2004 | 2005 | 2006 | 2007 | 2008 | 2009 | 2010 | 2011 | 2012 | 2013 | 2014 | 2015 |
| other data | ||||||||||||||||||||
| ROA | % | ... | -0.944 | 1.60 | 0.698 | 0.730 | -2.15 | |||||||||||||
| Gross Margin | % | ... | 24.0 | 24.7 | 22.3 | 25.1 | 26.6 | |||||||||||||
| Employees | 10,907 | 11,174 | 10,932 | 10,388 | 10,730 | |||||||||||||||
| Cost Per Employee | USD per month | ... | 2,331 | 2,412 | 2,818 | 2,664 | 2,453 | |||||||||||||
| Cost Per Employee (Local Currency) | EUR per month | ... | 1,676 | 1,823 | 2,027 | 2,075 | 1,848 | |||||||||||||
| Staff Cost (As % Of Total Cost) | % | ... | 18.7 | 18.4 | 19.2 | 21.2 | 19.8 | |||||||||||||
| Effective Tax Rate | % | ... | -31.4 | 10.9 | 18.1 | 38.0 | -22.6 | |||||||||||||
| Enterprise Value (EV) | USD mil | ... | ... | ... | 921 | 798 | 590 | 579 | 620 | |||||||||||
| EV/EBITDA | ... | ... | ... | 12.6 | 5.55 | 4.89 | 4.98 | 5.97 | ||||||||||||
| EV/Capital Employed | ... | ... | ... | 0.759 | 0.677 | 0.527 | 0.535 | 0.546 | ||||||||||||
| EV/Sales | ... | ... | ... | 0.558 | 0.436 | 0.298 | 0.357 | 0.376 | ||||||||||||
| EV/EBIT | ... | ... | ... | 54.5 | 10.7 | 11.6 | 10.0 | 12.8 | ||||||||||||
| Domestic Sales | EUR mil | ... | ... | ... | ... | ... | ... | ... | ... | ... | ... | ... | ... | ... | ... | ... | ... | ... | ||
| Capital Expenditures (As % of Sales) | % | ... | 2.04 | 2.85 | 2.89 | 4.24 | 4.91 | |||||||||||||
| Revenues From Abroad | EUR mil | ... | ... | ... | ... | ... | ... | ... | ... | ... | ... | ... | ... | ... | ... | ... | ... | ... | ||
| Revenues From Abroad (As % Of Total) | % | ... | ... | ... | ... | ... | ... | ... | ... | ... | ... | ... | ... | ... | ... | ... | ... | ... | ||
| Employees (Slovenia) | ... | ... | ... | ... | ... | ... | ... | ... | ... | ... | 8,104 | 7,450 | 7,129 | 6,279 | 6,716 | |||||
| Sales from Home Appliances Division | EUR mil | ... | ... | ... | ... | ... | 925 | 979 | 1,056 | 1,071 | ... | ... | ... | |||||||
| Sales from Home Interior Division | EUR mil | ... | ... | ... | ... | ... | ... | ... | ... | ... | 40.7 | 34.4 | 32.9 | 97.3 | ... | ... | ... | |||
| Sales from Ecology, Energy & Services Division | EUR mil | ... | ... | ... | ... | ... | ... | ... | ... | ... | 220 | 368 | 334 | ... | ... | ... | ... | |||
| Sales from Other Divisions | EUR mil | ... | ... | ... | ... | ... | ... | ... | ... | ... | ... | ... | ... | ... | ... | ... | ||||
| Sales in Western Europe | EUR mil | ... | ... | ... | ... | ... | ... | ... | ... | ... | ... | ... | 431 | 482 | 506 | 481 | 467 | |||
| Sales in Eastern Europe | EUR mil | ... | ... | ... | ... | ... | ... | ... | 723 | 836 | 786 | 682 | 685 | |||||||
| Sales in the Rest Of The World | EUR mil | ... | ... | ... | ... | ... | ... | ... | 32.1 | 64.4 | 95.0 | 100 | 89.3 | |||||||
| Sales in the EU | EUR mil | ... | ... | ... | ... | ... | ... | ... | ... | ... | ... | ... | ... | ... | ... | ... |
Get all company financials in excel:


Gorenje is a Slovenia-based manufacturer of white goods (larger home appliances). With a continent-wide market share of 4%, it is one of the eight largest manufacturers of home appliances in Europe. The Company operates through three business segments: Home, producing and selling products and services for home, such as major domestic appliances (MDA), small domestic appliances (SDA), heating, ventilation, air conditioning (HVAC) and kitchen furniture. Appliances are sold under company's own brands Gorenje, Mora, Atag, Pelgrim, Etna, Körting and Sidex, and are produced in the main production facility in Velenje as well as at the cooking appliances plant Mora Moravia in Mariánské Údolí (Czech Republic) and at the fridge-freezer plant in Valjevo (Serbia).
Gorenje has been growing its sales by a year on average in the last 5 years. EBITDA has fallen on average by 5.92% a year during that time to total of EUR 80.1 mil in 2015, or 6.54% of sales. That’s compared to 6.59% average margin seen in last five years.
The company netted EUR -8.20 mil in 2015 implying ROE of -2.21% and ROCE of -1.04%. Again, the average figures were -0.790% and -0.380%, respectively when looking at the previous 5 years.
Gorenje’s net debt amounted to EUR 330 mil at the end of 2015, or 0.905 of equity. When compared to EBITDA, net debt was 4.13x, down when compared to average of 4.22x seen in the last 5 years.
Gorenje stock traded at EUR 4.60 per share at the end of 2015 resulting in a market capitalization of USD 136 mil. Over the previous five years, stock price fell by 65.3% or -19.1% a year on average. The closing price put stock at a 12-month trailing EV/EBITDA of 5.19x and price to earnings (PE) of -13.7x as of 2015.
 Helgi Library